
Fig. 2: Single-nucleus transcriptomics reveals immense diversity within the autonomic nervous system and partition cells.
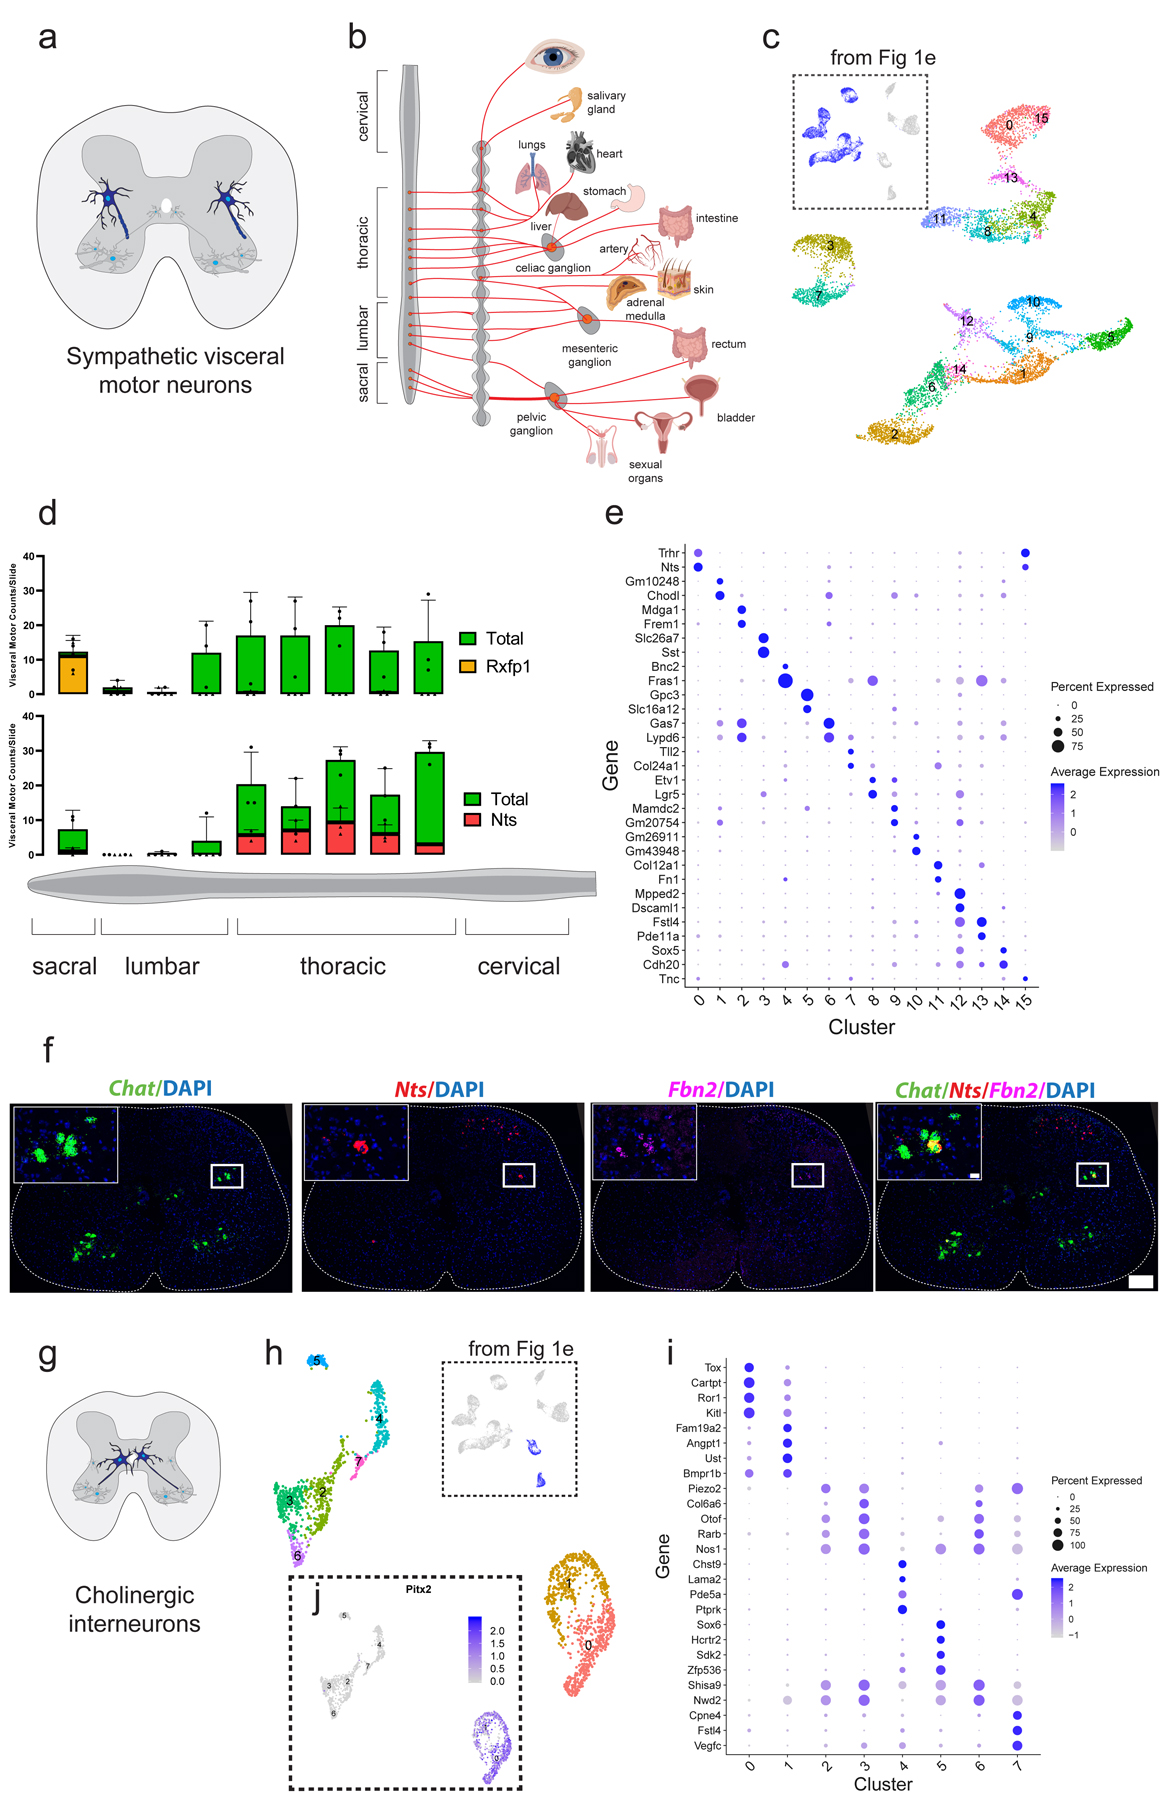
a, Schematic illustrating the position of sympathetic visceral motor neurons (blue) in the lateral autonomic column of the spinal cord. b, Diagram adapted from Espinosa-Medina 2016 showing innervation targets of the sympathetic nervous system12. c, UMAP with 16 visceral motor neuron subclusters. Inset shows all cells from Fig. 1e that were subclustered. d, Frequency of visceral motor neuron subpopulations (Rxfp1+ and Nts+) along the rostral-caudal axis of the spinal cord. Individual data points for total visceral motor neurons shown with filled circles, while marker gene-positive cell numbers shown with filled triangles. n=3 biologically independent animals. e, Novel marker genes for each cluster of visceral motor neurons. f, Representative in situ hybridization of Chat, Nts, and Fbn2 demonstrating Nts expression in visceral motor neurons. 200 µm scale bar in overview and 20 µm in inset. n=3 biologically independent animals. g, Schematic showing cholinergic interneuron innervation of skeletal motor neurons as demonstrated previously25. h, UMAP with graph-based clustering labels for cholinergic interneurons. Inset shows all cells from Fig. 1e that were subclustered. i, Novel marker genes for cholinergic interneuron clusters identified. j, Expression of Pitx2 in cholinergic interneuron populations, overlaid on UMAP projection from (h). Cluster 0 and 1 are Pitx2-positive. All expression values were log-normalized in Seurat50. Dot size is proportional to the percent of each cluster expressing the marker gene, while blue color intensity is correlated with expression level in (e,i).