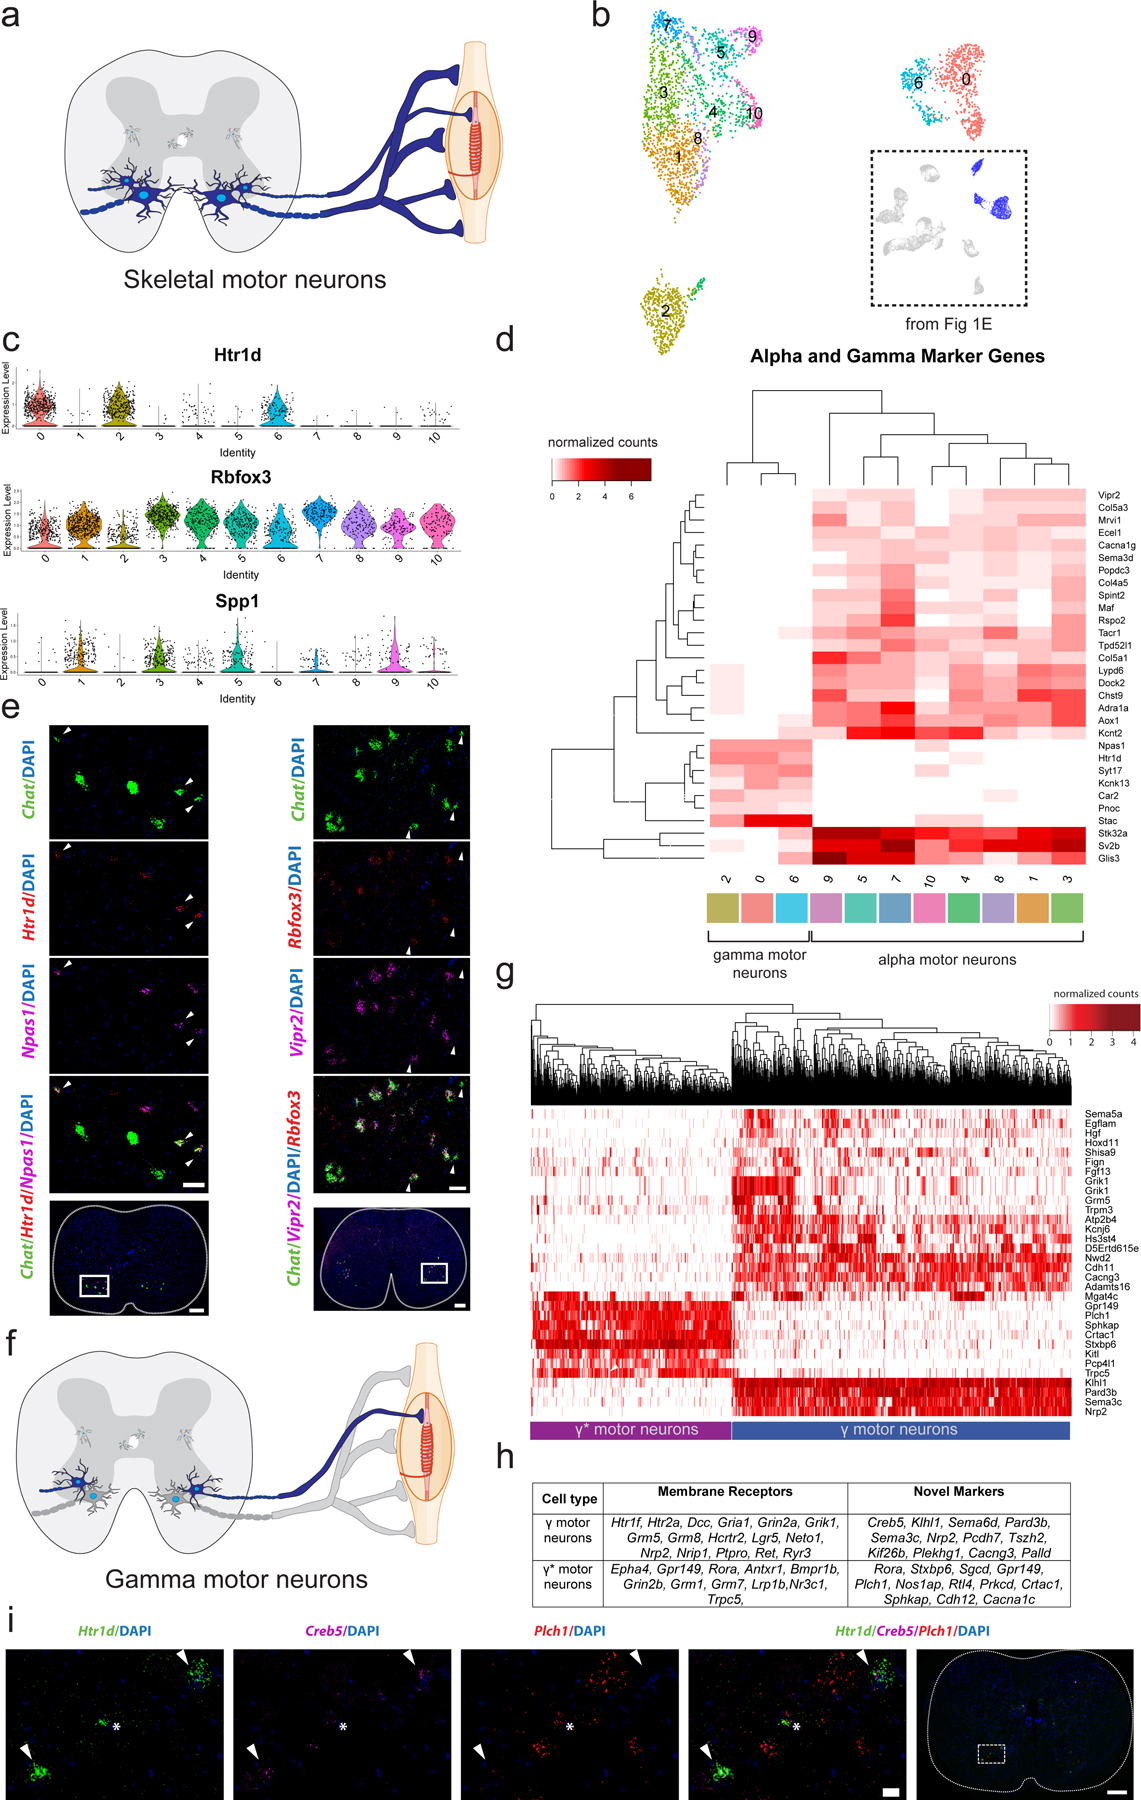
Fig. 3: Transcriptional differences between alpha (α) and gamma (γ) motor neurons.

a, Transverse schematic illustrating position of skeletal motor neurons (blue) in the ventral horn of the spinal cord. Gamma motor neurons are small and innervate intrafusal muscle fibers. α motor neurons are large and innervate extrafusal fibers. b, UMAP with 11 subclustered skeletal motor neurons populations. Inset shows all cells from Fig 1e that were subclustered. c, Average expression of known γ marker Htr1d and α markers Rbfox3 and Spp1 by cluster. d, Heatmap with average expression by cluster of differentially expressed genes in α and γ populations. Differentially expressed genes between γ and α populations. e, Representative in situ hybridization against Chat/Htr1d/Npas1 and Chat/Rbfox3/Vipr2 in transverse lumbar spinal cord sections. Arrowheads indicate γ motor neurons in both images. Scale bars are 200 µm (overview) and 50 µm (inset). n=4 biologically independent animals. f, Transverse schematic illustrating γ motor neurons (blue) innervating intrafusal muscle fibers. Inset shows all cells from Fig 3b that were subsequently subclustered. g, Heatmap showing fundamental subdivision between γ and γ* motor neurons, hierarchically clustered by expression of highly variable genes among all classes of γ motor neurons (see Methods). h, Differentially expressed membrane receptors between two main populations of γ motor neurons, as well as novel markers that delineate them. i, Representative in situ hybridization against Htr1d/Plch1/Creb5 in transverse lumbar spinal cord. Plch1 and Creb5 are expressed reciprocally in Htr1d+ cells and represent γ and γ* motor neurons. Arrow heads demarcate Creb5+ γ motor neurons and * indicates γ* motor neurons. n=5 biologically independent animals. All differential expression calculated using Wilcoxon rank sum test and adjusted for multiple comparisons (Bonferroni method) (p_adj < 0.01, log2fc>0.5). All expression values were log-normalized in Seurat50. Scale bars=50 µm.
