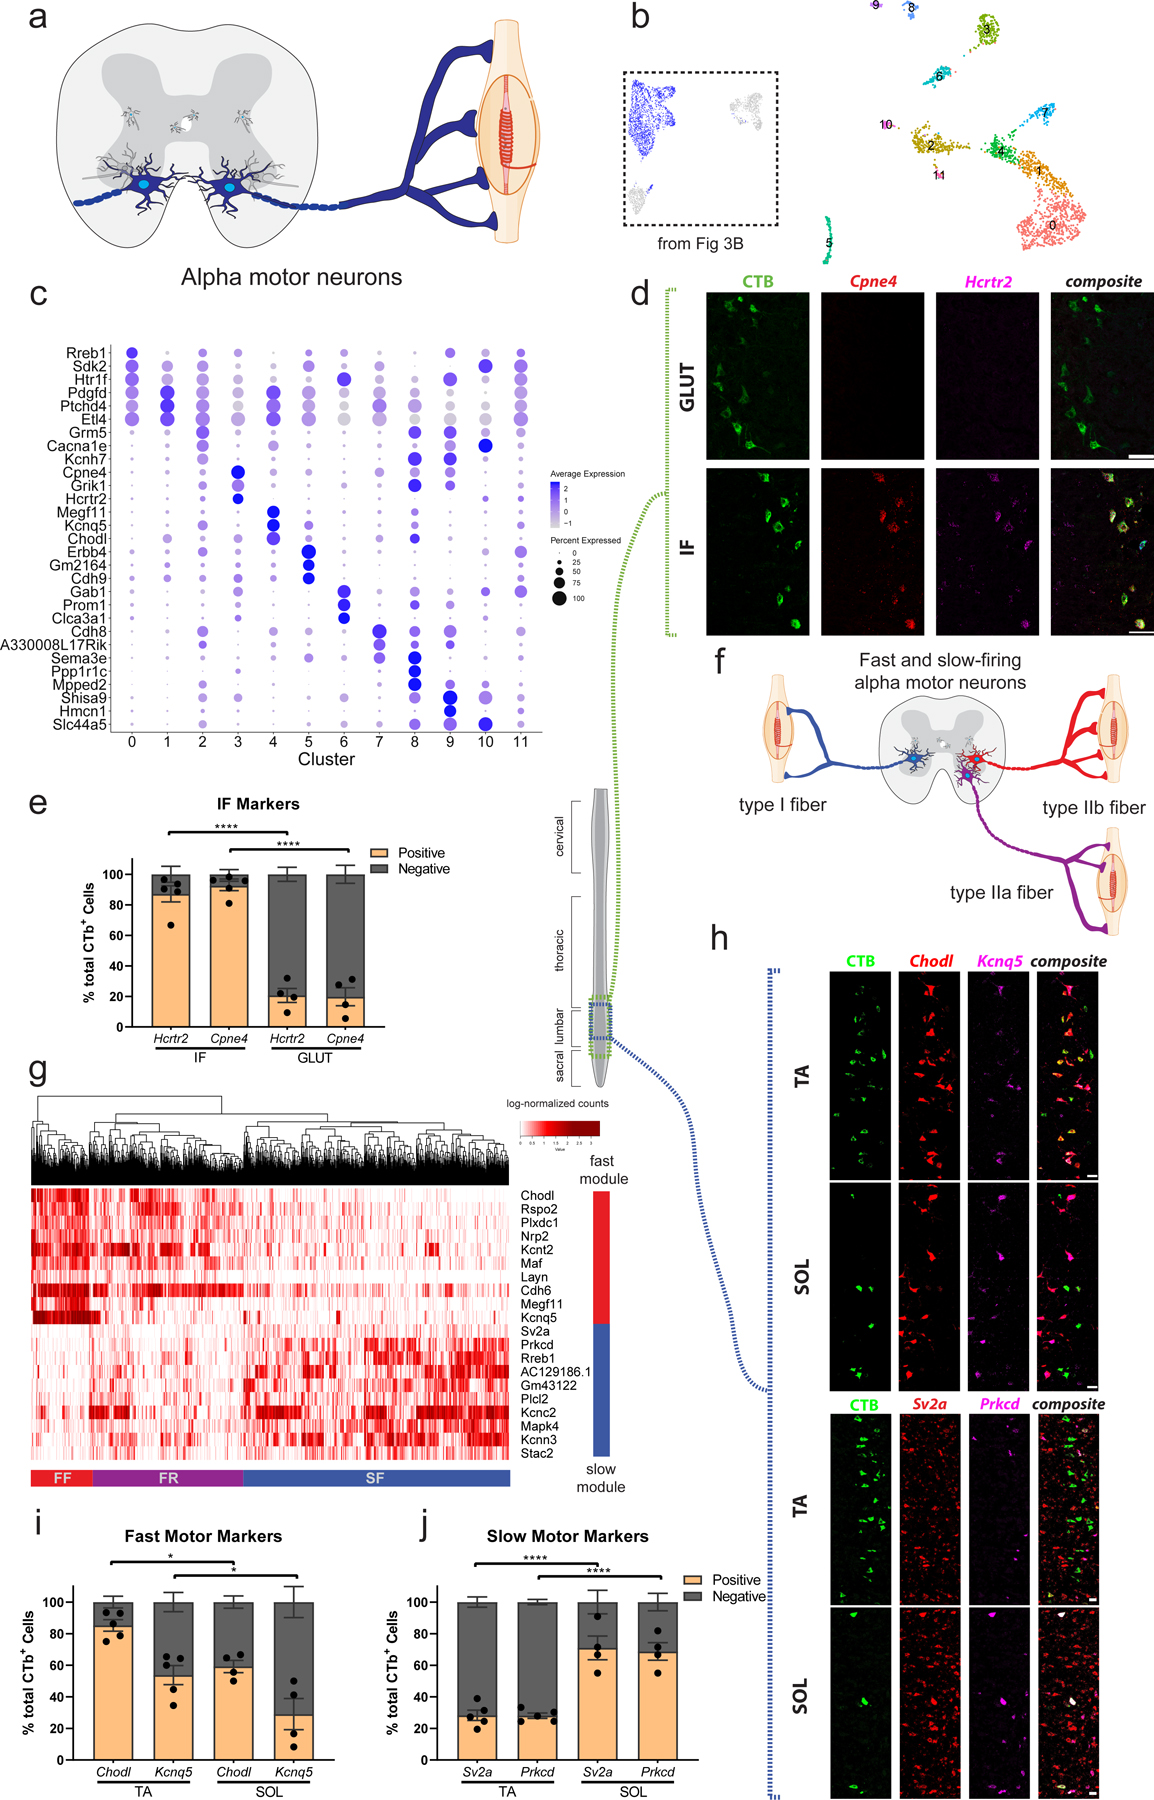
Fig. 4: Alpha (α) motor neuron pool, position, and electrophysiological subtype reflect transcriptional differences.

a, Transverse schematic shows α motor neurons (blue) innervating extrafusal muscle fibers. b, UMAP with 12 subclustered α motor neuron populations. Inset shows all α motor neurons from Fig. 3b that were subclustered. c, Novel marker gene expression across α motor neuron subpopulations. Dot size is proportional to the percent of each cluster expressing the marker gene, while blue color intensity is correlated with expression level. d, Representative in situ hybridization against novel (Hcrtr2) and known (Cpne4) intrinsic-foot (IF) motor pool markers in longitudinal sections, overlaid with CTb labeled cells that innervate the gluteus (GLUT) and IF. n=5 (IF) and 4 (GLUT) biologically independent animals. e, Proportion of CTB-labeled cells from GLUT and IF that are labeled with Hcrtr2 and Cpne4 shows novel and known markers selectively label the IF motor pool. n=5 (IF) and 4 (GLUT) biologically independent animals. f, Schematic illustrating slow-firing (SF, blue), fast fatigue-resistant (FR, purple) and fast fatigable (FF, red) α motor neuron populations innervating type I, IIa, and IIb fibers respectively. g, Heatmap showing all α motor neurons hierarchically clustered and colored by expression of differentially expressed genes between fast (Chodl+) and slow (Sv2a+) α motor neurons shows three cell populations corresponding to SF, FR, and FF motor neurons. Red and blue bars show gene modules enriched in fast- and slow-firing α motor neurons, respectively. h, Representative in situ hybridization in longitudinal sections against novel (Kcnq5, Prkcd) and known (Chodl, Sv2a) fast and slow-firing motor neuron markers, respectively. Images show CTb labeled cells that innervate a muscle with predominantly fast-twitch fibers (TA) and slow-twitch fibers (SOL). n=5 (TA) and 4 (SOL) biologically independent animals. i, Proportion of CTB-labeled cells from TA and SOL that are labeled with Chodl and Kcnq5. The TA has a significantly larger proportion of Chodl+ and Kcnq5+ cells than the SOL, though Kcnq5+ cells are significantly less frequently found in both populations. n=5 (TA) and 4 (SOL) biologically independent animals. Adjusted p-values=0.0197 (Chodl), 0.0262 (Kcnq5). j, Proportion of CTB-labeled cells from TA and SOL that are labeled with Sv2a and Prkcd. The SOL pool has a significantly larger proportion of Prkcd+ and Sv2a+ cells than the TA. n=5 (TA) and 4 (SOL) biologically independent animals. All differential expression calculated using Wilcoxon rank sum test and adjusted for multiple comparisons (Bonferroni method) (p_adj < 0.01, log2fc>0.5). All expression values were log-normalized in Seurat50. Scale bars=50µm (h), 75 µm (all others). One-way ANOVA with post-hoc Sidak multiple comparison test between same-gene conditions. *=p value<0.05, **=p value <0.01, ***=p value<0.001, ****=p value<0.0001. Error bars are SEM.
