
Extended Data Fig. 1. Single-nucleus transcriptional analysis of the adult mouse spinal cord reveals canonical cell types.
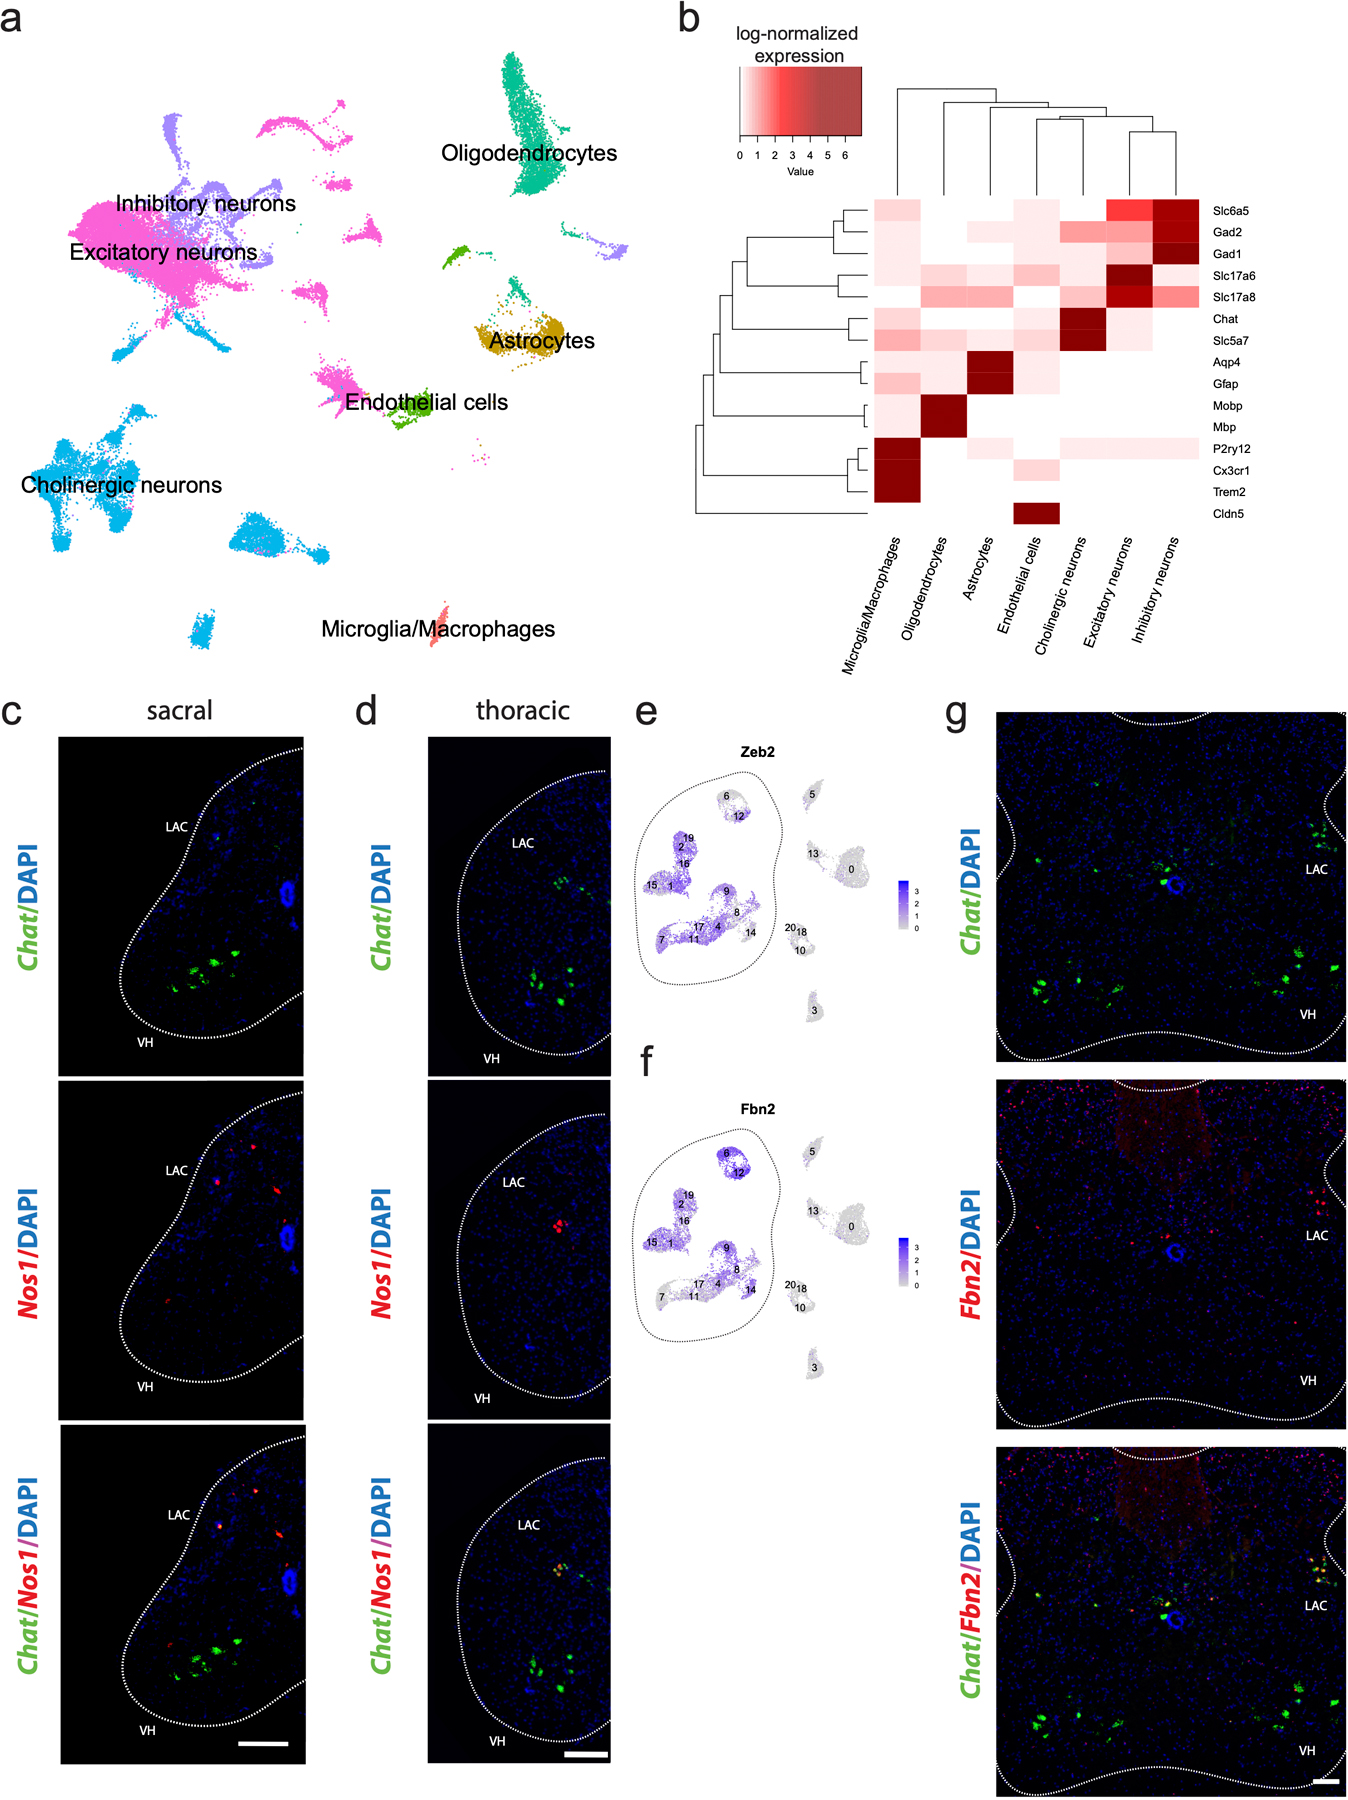
a, Canonical cell class labels, visualized on UMAP. b, Average log-normalized marker gene expression across canonical cell classes. c–d, Representative in situ hybridization against Chat/Nos1 in transverse sacral (c) and thoracic (d) spinal cord hemi-sections. n=3 biologically independent animals. e-f, Average log-normalized expression of Zeb2 (e) and Fbn2 (f) across all cholinergic clusters (labeled), overlaid on UMAP. Dotted line surrounds clusters corresponding to visceral motor neurons. g, Representative in situ hybridization against Chat/Fbn2 in transverse thoracic spinal cord hemi-section. n=3 biologically independent animals. Scale bars=200 µm (c–d) and 100 µm (g). LAC=lateral autonomic column (c,d), VH=ventral horn (c,d).