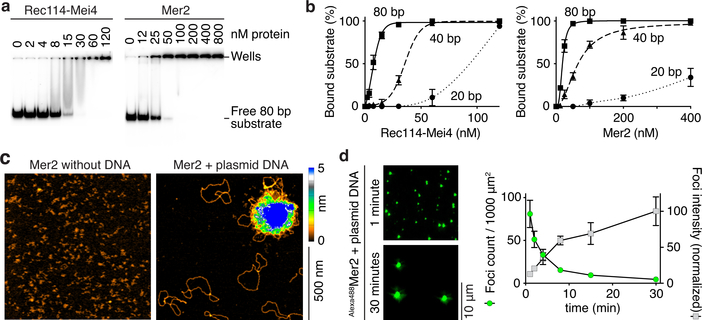
Fig. 2: Rec114–Mei4 and Mer2 form condensates on DNA.
a. Gel shift analysis of Rec114–Mei4 and Mer2 binding to 80 bp DNA substrates (see also Extended Data Fig. 2a, b). b. Quantification of gel-shift analyses with 20-, 40- or 80 bp substrates. Error bars are ranges from two independent experiments. Lines are sigmoidal curves fit to the data, except for the 20 bp substrate (smooth spline fits). Apparent affinities of Rec114–Mei4 are: 6 ± 1.4 nM (80 bp, mean and range); 35 ± 1.3 nM (40 bp); ≈ 80 nM (20 bp). Apparent affinities of Mer2 are: 19 ± 1.5 nM (80 bp); 64 ± 15 nM (40 bp); > 400 nM (20 bp). Here and elsewhere, concentrations for Rec114–Mei4 refer to the trimeric complex, but for Mer2 they refer to the monomer. Therefore, the complexes have comparable affinities for DNA if the quaternary units (trimers and tetramers, respectively) are considered. c. AFM imaging of 50 nM Mer2 in the absence (left) or presence (right) of 1 nM plasmid DNA (pUC19). d. Time course of the assembly of Mer2 foci in the presence of plasmid DNA. The x axis indicates the time in solution before plating, upon which DNA is immobilized to the glass slide while soluble protein is still free to diffuse. Quantification is provided of focus numbers and average focus intensity (normalized to the mean at 30 min). Error bars show mean ± SD from 8–10 fields of view (see Source Data for exact n values). For gel source data, see Supplementary Figure 1.

