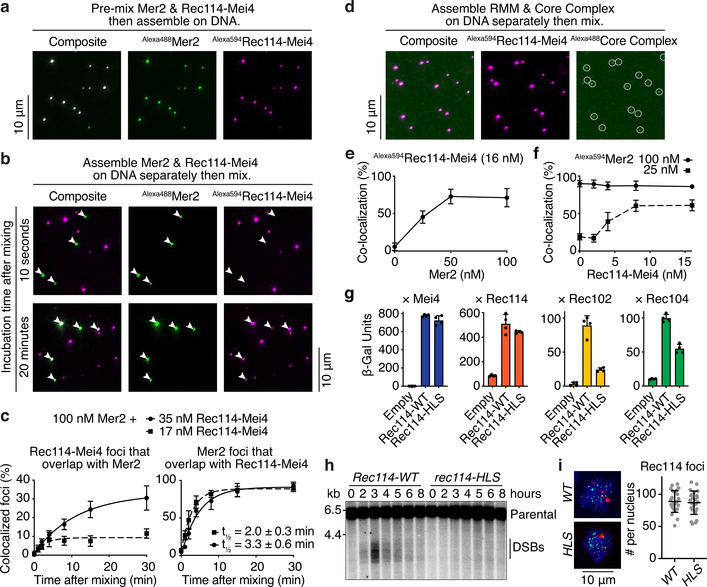
Fig. 4: Tripartite Rec114–Mei4–Mer2 nucleoprotein condensates recruit the Spo11 core complex.
a. Fluorescently labeled Rec114–Mei4 (17 nM) and Mer2 (100 nM) were mixed prior to DNA-driven condensation (for 30 minutes, 5.6 nM pUC19) and imaging by epifluorescence microscopy. b. Rec114–Mei4 and Mer2 nucleoprotein condensates were assembled separately for 10 minutes then mixed. After mixing, reactions contained 5.6 nM pUC19, 8.5 nM Alexa594Rec114–Mei4 and 50 nM Alexa488Mer2. Samples were dropped on a microscope slide 10 seconds (top) or 20 minutes (bottom) after mixing. White arrowheads indicate Mer2 condensates. c. Time course of Rec114–Mei4 and Mer2 colocalization. The time to achieve 50% of Mer2 foci overlapping with Rec114–Mei4 is indicated (t1/2). Lines are one-phase association models fit to the data. Error bars show mean ± SD from 9–10 fields of view. d. Incorporation of Alexa488-labeled core complexes10 into Alexa594-labeled Rec114–Mei4–Mer2 condensates. e. Fraction of Rec114–Mei4 foci that contained detectable core complex signal as a function of Mer2 concentration. Error bars show mean ± SD from 10 fields of view. f. Fraction of Mer2 foci that contained detectable core complex signal as a function of Rec114–Mei4 concentration. Error bars show mean ± SD from 9–10 fields of view. g. Y2H interaction between Gal4AD-Rec114 wild type or H39A/L40A/S41A (HLS) mutant and LexA-Mei4, LexA-Rec114, LexA-Rec102, or LexA-Rec104 (mean and SD from four replicates). h. Southern blot analysis of meiotic DSB formation at the CCT6 hotspot. i. Immunofluorescence microscopy of meiotic chromosome spreads with myc-tagged Rec114-WT and HLS mutant strains. Green, anti-myc (Rec114); red, anti-Zip1; blue, DAPI. Quantification of the number of Rec114 foci per leptotene or early zygotene cell is plotted (n = 24). Line and error bars represent mean ± SD. For gel source data, see Supplementary Figure 1. See Source Data for exact n values for panels c and f.

