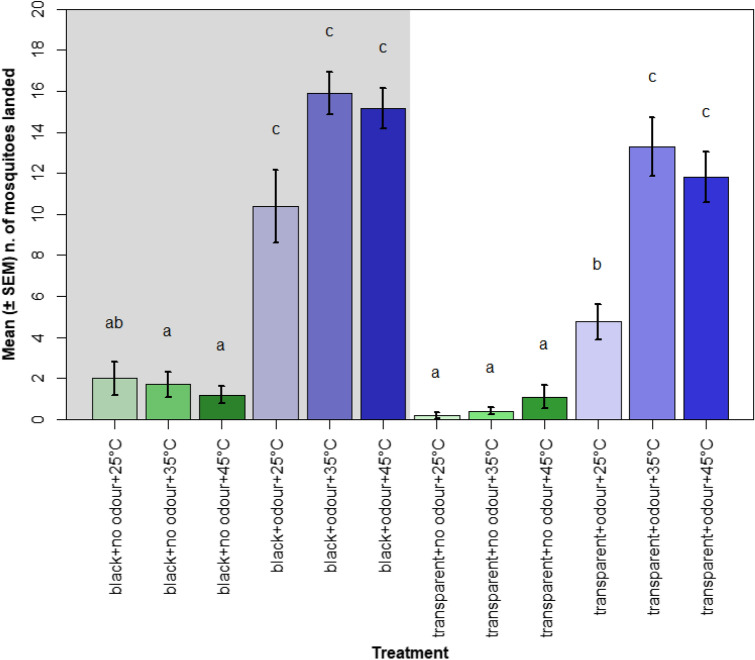
Figure 3.
Mean number of mosquitoes (± SEM) found on the landing surface in each treatment. The y-axis shows the twelve different treatments, where “black” and “transparent” indicate the different visual cues offered, “no odour” and “odour” indicate the absence or presence of host odour, and the temperature indicates the thermal cue used. Blue bars indicate host odour was present during assays, green bars indicate it was absent. Paler colours denote lower temperatures and darker colours indicate higher temperatures. Background colour indicates the presence (grey) or absence (white) of the visual cue. Different letters denote significant differences between treatments (Tukey contrast comparisons test, P < 0.01).

