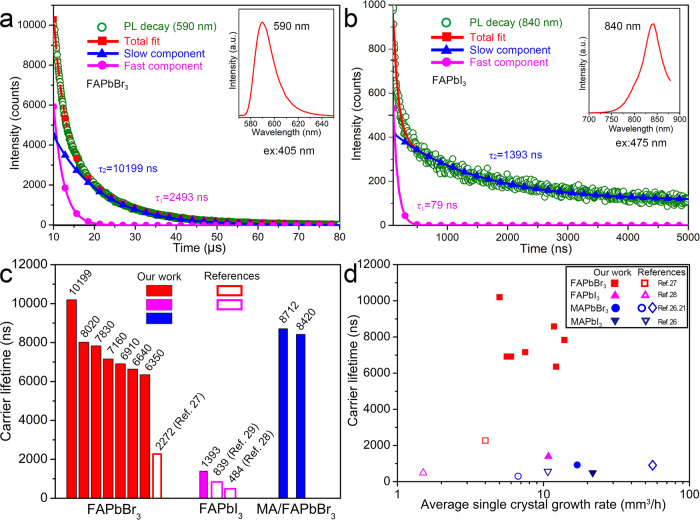
Fig. 2. Carrier lifetime measurements.
Steady and transient state photoluminescence (PL) spectra are measured using a 405 and 475 nm excitation wavelengths, respectively. PL decay curves of a the FAPbBr3 single crystal and b the FAPbI3 single crystal. c Comparison of carrier lifetimes of OIHPs single crystals (seven FAPbBr3 samples are tested)27–29. d The correlations between carrier lifetimes and average single crystal growth rates (in volume) based on our work and literatures21,26–28.

