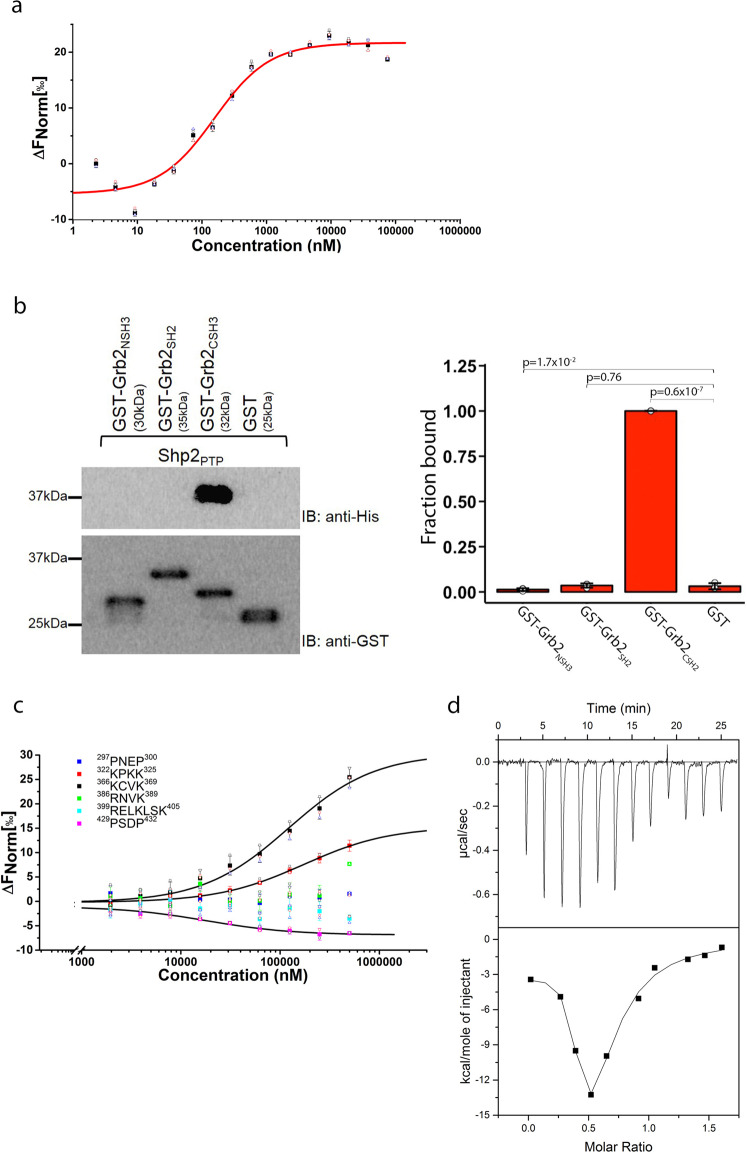
Fig. 3. Characterisation of Grb2Y160E binding to Shp2PTP domain.
a MST measurement of Shp2PTP binding to fluorescent labelled Grb2Y160E (0.1 µM). Both PTP domain and tandem 2SH2 domains show similar affinity to Grb2Y160E. Data are presented as (mean ± SD) of technical triplicates. b GST pull-down experiment using GST-tagged individual Grb2 domain (NSH3, SH2 and CSH3) to precipitate Shp2 PTP domain. The result clearly indicates the interaction is mediated through Grb2 CSH3 domain. The blot represents three independent experiments. Inset: densitometric analysis of GST pull-down results. Results are represented as mean ± SD. Statistics were determined using an unpaired Student’s t test. c Sequence analysis identifies six potential PxxP or R/KxxK (x is any amino residue) motifs for Grb2 CSH3 domain interaction. Synthesised peptides were used to test the interactions with Grb2 CSH3 domain (Atto 488 labelled, 0.1 µM) using MST. The results show 322KPKK325, 366KCVK369 and 429PSDP432 interact with Shp2 PTP domain. Motif 429PSDP432 binds to Shp2 PTP domain with the highest affinity of 18 µM. See Table for detailed information and peptide sequences. Data are presented as (mean ± SD) of technical replicates (peptide 322–325 and peptide 429–432) or triplicates. d ITC was used to corroborate the two binding events between Shp2 and Grb2Y160E. Grb2Y160E (200 µM) was titrated into Shp2Δ69 (25 µM). Twelve 3 µl injections of Grb2Y160E were titrated into Shp2Δ69. Top panel: baseline-corrected power versus time plot for the titration. Bottom panel: the integrated heats and the molar ratio of the Grb2Y160E to Shp2Δ69.

