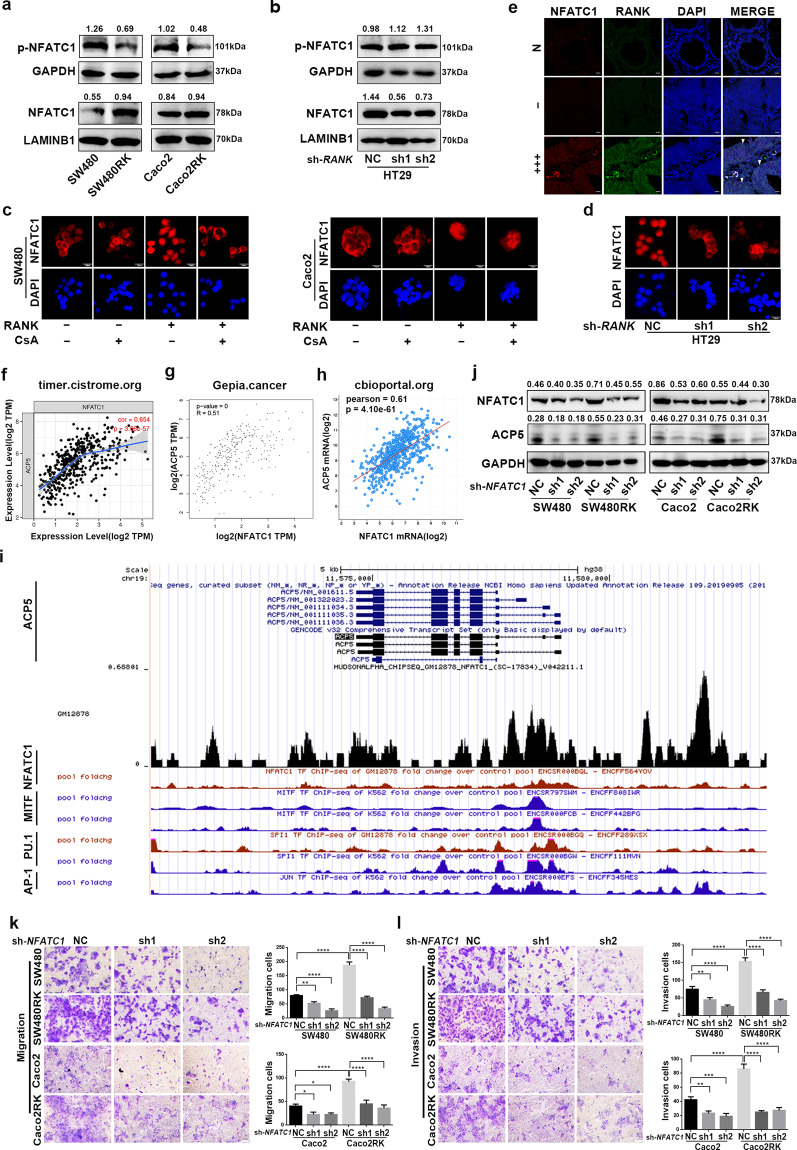
Fig. 4. RANK upregulated ACP5 expression through driving NFATC1 nuclear translocation.
a, b Western blotting analyzed the protein levels of phosphorylated NFATC1 and NFATC1 in cytoplasm, and nucleus of RANK-overexpressing or knockdown CRC cells. GAPDH served as the cytoplasmic control and lamin B1 as the nuclear protein loading control. c Immunofluorescence staining of subcellular localization of NFATC1 in RANK overexpression and control cells with or without treatment of 10 μg/ml cyclosporin A (CsA). Scales bars = 20 μm. d Representative immunofluorescence of subcellular localization of NFATC1 in RANK-depleted HT29 cells. Scales bars = 20 μm. e The NFATC1 subcellular localization in matched normal tissues, negative and high RANK expression of CRC tissues by immunofluorescence staining. DAPI (nuclei, blue). RANK is visualized in the membranes and in the cytoplasm surrounding the nucleus of the NFATC1 in CRC tissues (white arrowheads). − (score 0), +++ (score 9–12). N paired normal colorectal tissues. Scales bars = 10 μm. f–h Correlation analysis between mRNA levels of NFATC1 and ACP5 from indicated online datasets. i ChIP-seq data showed a UCSC Genome Browser screenshot of the ACP5 promoter region for NFATC1 and SPI1 in GM12878 cells and MITF, SPI1, and JUN in K562 cells from ENCODE. j NFATC1 knockdown reversed RANK-induced ACP5 expression. k, l Silencing of NFATC1 decreased RANK-induced migration and invasion in SW480 and Caco2 cells. Scales bars = 100 μm. Data are mean ± SD (n = 3). *P < 0.05, **P < 0.01, ***P < 0.001, ****P < 0.0001.

