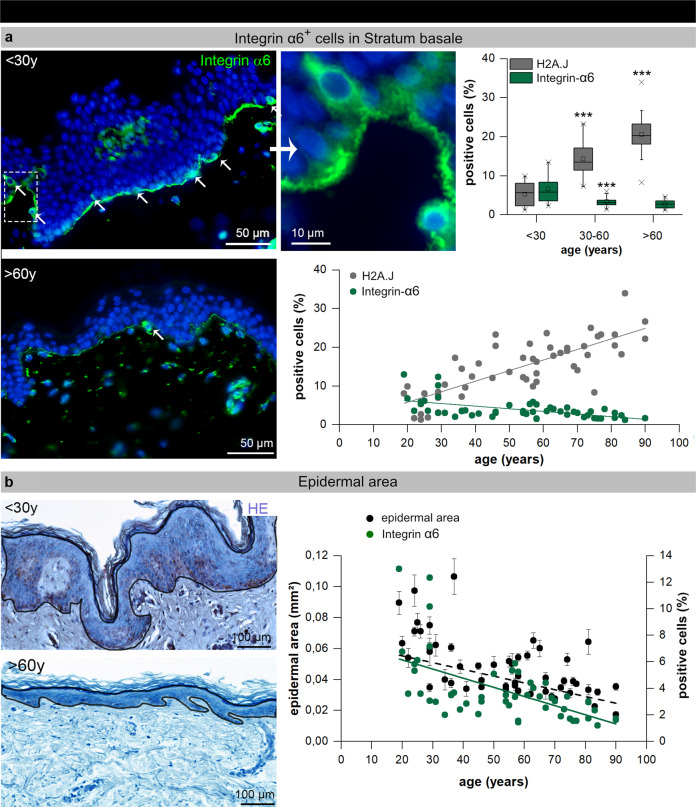
Fig. 5. Epidermal stem cells and epidermal thickness during human skin aging.
a IF micrographs of integrin-α6 expression in young and aged human skin. The selected area is shown at higher magnification (left panel). Quantification of integrin-α6+ cells in human epidermis of donors of varying age depicted per age-group (upper panel: The horizontal line in the box represents the median, the box shows the interquartile range [25–75th percentile] and the whiskers represent the 5–95th percentile) and for the entire age cohort (n = 52; lower panel). ***p < 0.001 significant statistical difference to younger age-group. b Micrographs of H&E stained human skin of young and aged donors. Measured areas of the epidermis (without corneal layer) are indicated by black lines. Graphic presentation of measured epidermal areas and integrin-α6+ cells in relation to donor-age (n = 52).

