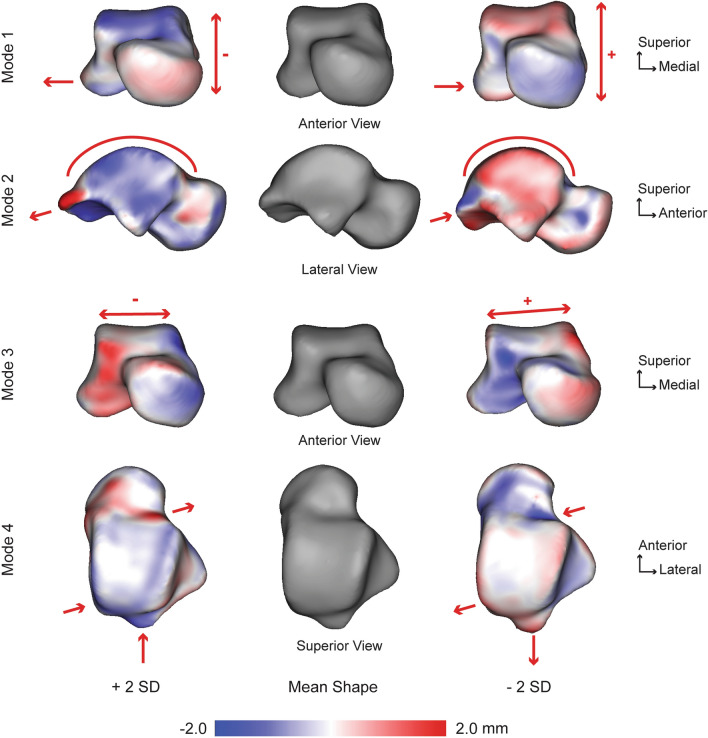
Figure 3.
Talar modes of variation 1–4 showing significant anatomical differences observed at ± 2 standard deviations (SD) from the mean shape (center; grey). Red arrows focus on the location and direction of change for key anatomical features (pointing at the bone indicates the decreased size of a feature, whereas an arrow pointing away from the bone indicates an increased size of a feature). Surface distances shown on ± 2 SD represent the distance away from the mean shape with a scale in millimeters (mm).

