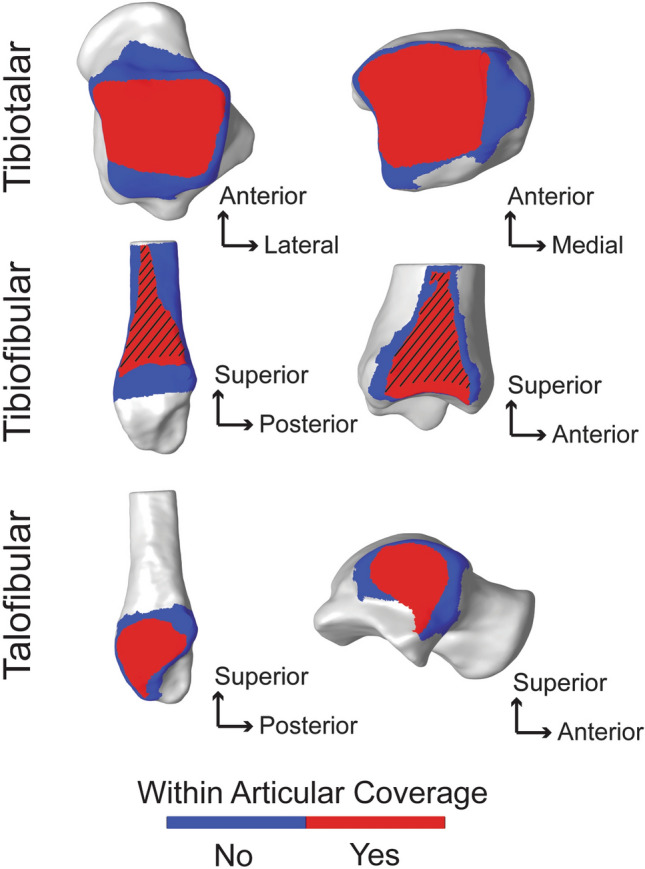
Figure 4.

Coverage analysis showing regions of articular coverage for the tibiotalar, tibiofibular and talofibular joints. Regions within the articular coverage are shown in red. Regions in blue represent the initial region of selection based on the second principal curvature, with the rest of the bone shown in grey. Important to note, the articular coverage regions are defined mathematically as described in the methods and due to the imaging limitation of WBCT cannot be directly correlated with regions containing articular cartilage. However, the region for the tibiofibular relationship, shown with the black angled lines, represents the region of the distal tibiofibular syndesmosis anatomically known to contain the interosseous ligament throughout this generalized region. Distal to the dashed region, at the base of the syndesmosis, there is typically a small tibiofibular contact zone32. But for the purpose of this analysis, the tibiofibular contact zone and syndesmosis regions were not separated mathematically within the articular coverage region identified.
