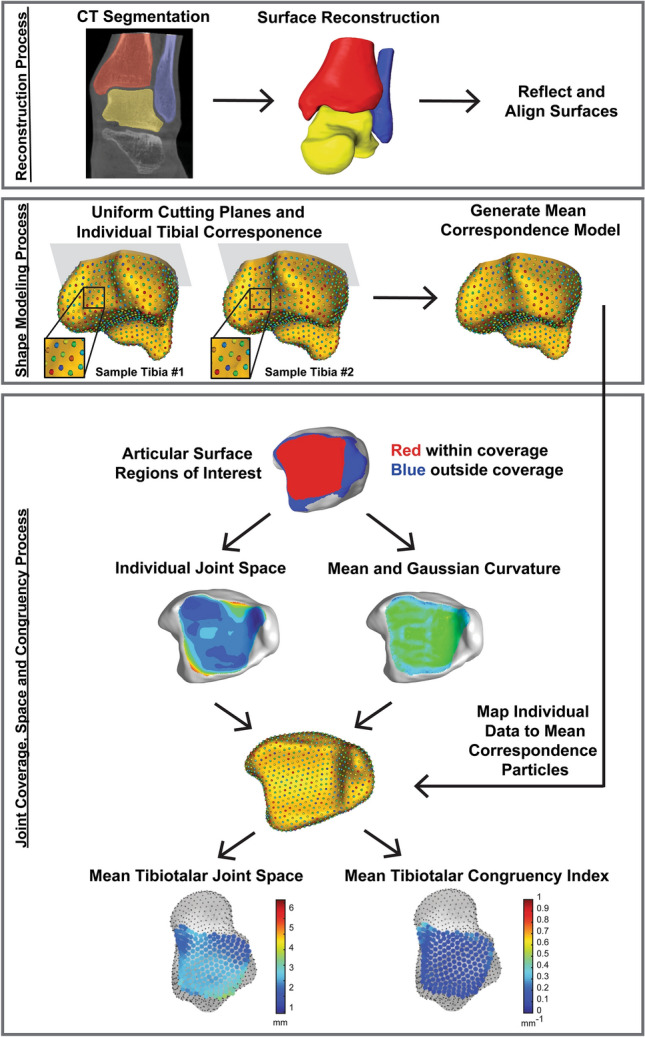
Figure 7.

Flow chart of image and model processing. Subject-specific tibia, fibula and talus bone models were segmented and reconstructed from weightbearing computed tomography scans. Surfaces were reflected (all right limbs) and aligned. Cutting planes for the tibia (shown in grey) and fibula were uniformly applied and used to limit correspondence particle locations on the proximal axial plane. Correspondence particles are visualized as the multi-color points on the golden tibia models. Correspondence particles are shown in a detailed zoomed in view within the fibular notch on two patient specific tibiae (Sample Tibia #1 and #2). The zoomed in view of correspondence particles demonstrates the unique location of each particle that is consistently and mathematically placed on each bone specimen. For example, the grouping of green, blue, and red particles shown will maintain this ordered location across all bones and in the resulting mean correspondence model. Mean correspondence models were used in conjunction with joint level analyses of coverage, joint space distance and congruency for the tibiotalar (shown), tibiofibular and talofibular articular regions. Resulting joint parameters were averaged and visualized at correspondence particle locations within the articular regions.
