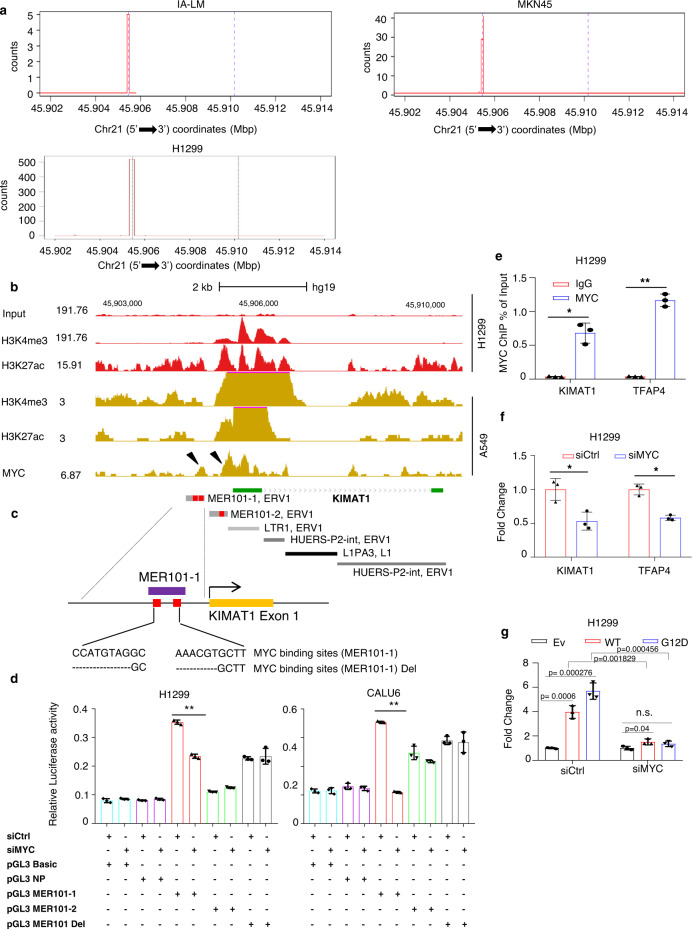
Fig. 2. KIMAT1 originates from TEs and is transcriptionally activated by MYC.
a Cap analysis of gene expression-sequencing (CAGE-seq), from lung and gastric cancer cells revealed the presence of a putative active promoter in KIMAT1 loci. CAGE-seq counts were defined by the FANTOM5 mammalian promoter expression atlas in the IA-LM and H1299 lung adenocarcinoma and MKN45 gastric cancer cell lines at the KIMAT1 loci. b In-house and University of California, Santa Cruz (UCSC) Genome Browser ChIP-seq data illustrating the recruitment of MYC to the KIMAT1 loci. Co-localization of H3K4me3 and H3K27ac at the TSS in A549 cells (brown) was integrated with H3K4me3 and H3K27ac in-house ChIP-seq data (red). MYC-binding sites (BS) are indicated by arrows. c, Schematic representation of KIMAT1 genomic locus composed by remnants of ERV1 and L1 DNA and enlargement of the MER-101-1 LTR containing two MYC BSs (in red). d Dual-luciferase assay in H1299 and CALU6 cells, showing that the MER101-1 LTR has promoter function as compared to control (Empty vector). MYC silencing reduced luciferase activity, while deletion of the two MYC BSs in the MER101-1 rescued this effect. A non-promoter region (NP) was used as negative control. **4.12E−05 in H1299 and **3.75E−08 in CALU6. e ChIP-qPCR in H1299 cells showing MYC or IgG enrichment (ChIP/input) in the KIMAT1 promoter region (MER-101-1). TFAP4 was used as positive control. *0.001694, **3E−05. f Expression of KIMAT1 in H1299 cells transfected with control siRNA (siCtrl) or MYC siRNA (siMYC). TFAP4 was used as positive control. siMYC vs siCtrl, KIMAT1 *0.018211 and siMYC vs siCtrl, TFAP4 *0.001253. g MYC KD suppressed the induction of KIMAT1 by wild type or mutant KRAS. Error bars indicate mean ± S.D, n = 3 replicates. p values were calculated by two tailed Student’s t test.

