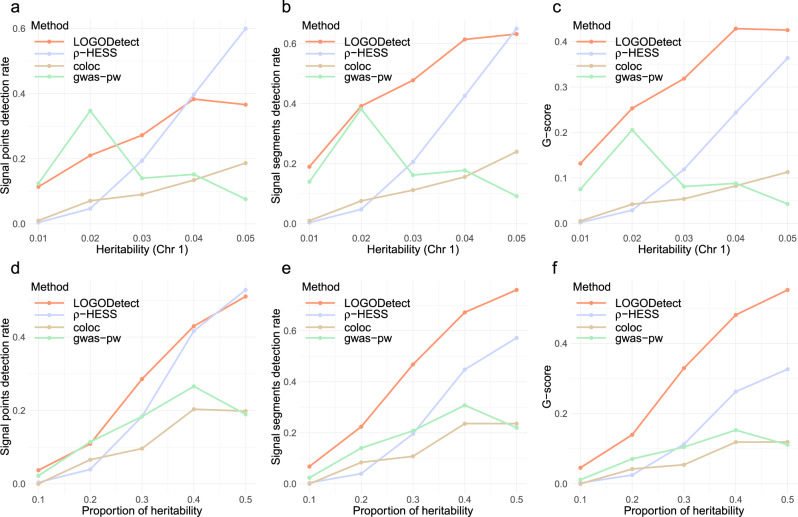
Fig. 2. Assessment of statistical power under a heritability-enrichment model with varying trait heritability and heritability enrichment.
The Y-axis shows the statistical power assessed by three different metrics: a, d signal points detection rate measures sensitivity at the SNP level, b, e signal segments detection rate measures sensitivity at the segment level, and c, f G-score jointly measures specificity and sensitivity. The heritability represents the trait heritability on chromosome 1 and the proportion of heritability represents the proportion of the trait heritability explained by the signal regions. Significance cutoffs for gwas-pw are adjusted so that the empirical type I error rate is controlled at 0.05. Details on the above three metrics and the adjustment procedure for the significance cutoff are discussed in the “Methods” section. Source data are provided as a Source Data file.

