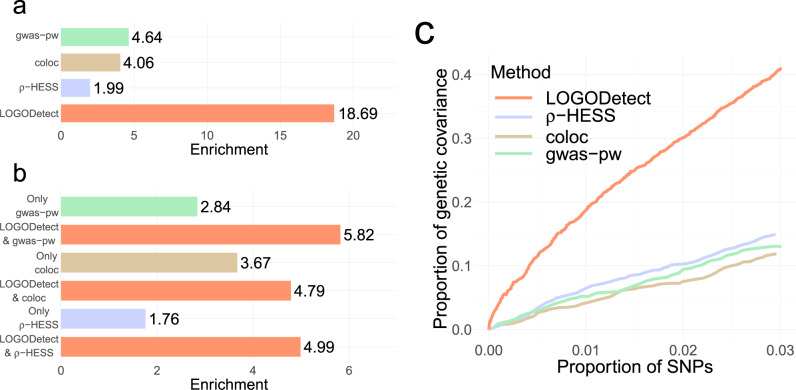
Fig. 4. LOGODetect identifies precise genomic regions harboring local genetic correlations.
Genetic covariance and its corresponding enrichment were calculated using stratified-LDSC10. a Genetic covariance fold enrichment (i.e. the ratio between the proportion of total genetic covariance and the proportion of the total SNP counts) in regions identified by LOGODetect, ρ-HESS, coloc, and gwas-pw, respectively. b Genetic covariance fold enrichment in regions identified by ρ-HESS, coloc, and gwas-pw that also overlapped with LOGODetect findings, and regions identified by ρ-HESS, coloc, and gwas-pw alone. c Genetic covariance explained and proportion of SNPs covered by regions identified by LOGODetect, ρ-HESS, coloc, and gwas-pw.

