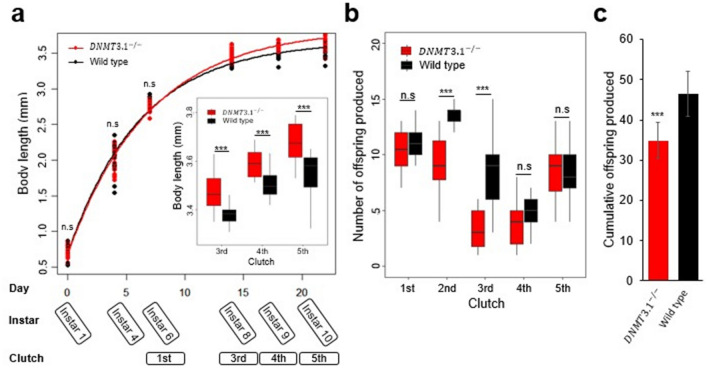
Figure 3.
Life-history traits of wild type and DNMT3.1−/− under starved condition (a) Body length measurements and fitted von Bertalanffy growth for 20 D. magna individuals of wild type and DNMT3.1−/−. Red and black lines correspond to fitted curves for DNMT3.1−/− and wild type, respectively, and boxplot of their body lengths from 3rd to 5th clutch stages. (b) Boxplot of the 20 D. magna’s clutch sizes cultured individually in starved condition. All boxplot whiskers extend to the highest and lowest values, and the boxes extended from quartile 1 to quartile 3, with the middle line showing the median. Asterisks denote significant differences by pairwise t-test; n.s., not significant; ***P < 0.001. (c) Bar graph of the cumulative offspring produced from the 20 individuals at 5th clutch. Error bars indicate the standard deviation of the mean. Asterisks denote significant differences by unpaired t-test; ***P < 0.001.

