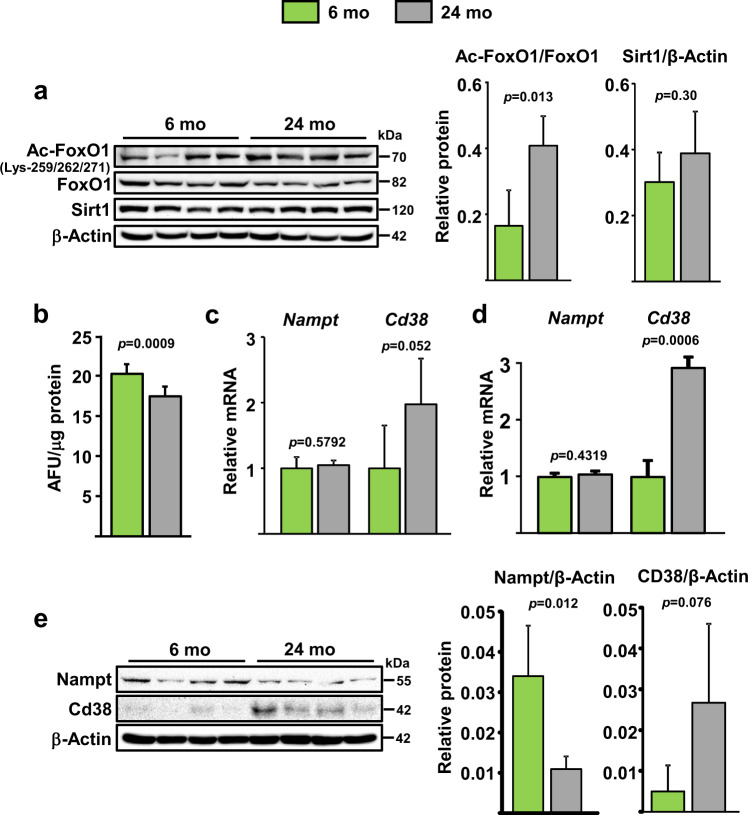
Fig. 1. NAD+ declines with age in bone marrow osteoblastic cells.
a Protein levels by western blot (left) and relative quantification (right) of band intensity in bone marrow stromal cells from 6- and 24-month-old C57BL/6 female mice cultured with ascorbic acid and β-glycerophosphate for 5 days; each lane represents one mouse (n = 4/group). b Relative cellular NAD+ levels in cultured osteoblastic cells pooled from 5 mice/group (triplicates of pooled cultures). AFU arbitrary fluorescence units. c, d mRNA levels by qRT-PCR in (c) CD45− cells freshly isolated from 6- and 24-month-old C57BL/6 female mice (n = 5/group) and d cultured cells described in a. e Protein levels in cultured stromal cells described in a. Bar graphs represent mean ± SD, data analyzed by Student’s t-test.

