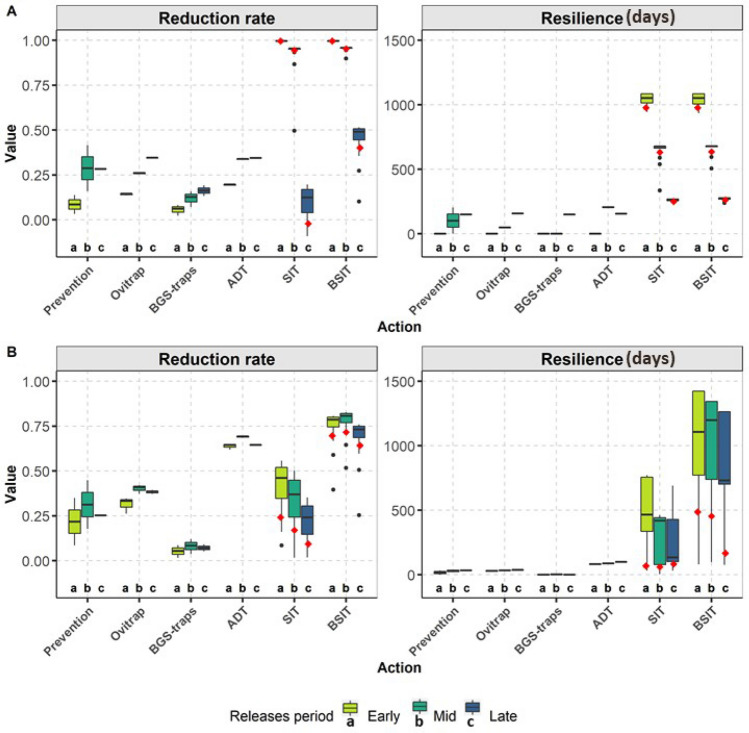
Figure 2.
Reduction rate and resilience of vector control actions against Aedes albopictus in (A) a temperate climate and (B) a tropical climate. The boxplots show the outputs distribution for a range of efforts invested in vector control action (Table 1), i.e. the number of devices deployed in the area (ADT, ovitraps and BGS-traps), the extend of prevention (e.g. source reduction) and the number of sterile males released for SIT and BSIT (all other parameters being kept constant at their reference value). Three periods of actions were tested: early in the year (Early) when the mosquito population is low, midway in the year (Mid) when the population is increasing, and later in the year (Late) when the population reaches its maximum. Resilience is given in number of days. Vector control actions were simulated on average meteorological dynamic and outputs were averaged over the 4 parcels studied(see “Methods”). Red diamonds indicate the results of simulations for SIT and BSIT with a reference number of released males (1000 males/ha).

