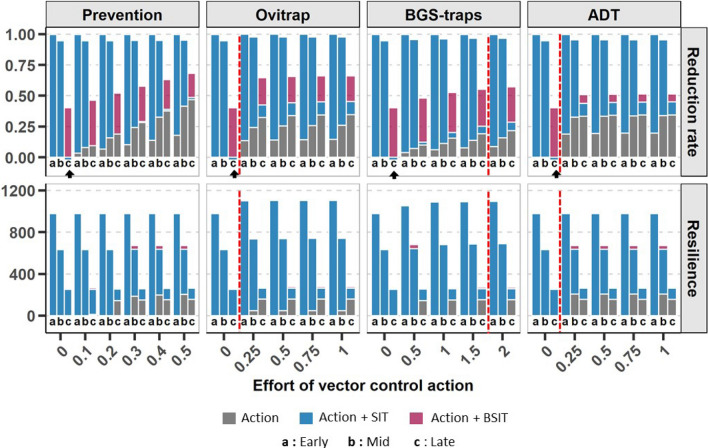
Figure 3.
Reduction rate and resilience in the temperate climate for an increasing effort in vector control actions against Aedes albopictus. Vector control actions (ovitraps, BGS-traps, ADT and prevention) are represented by grey bars. The benefits added by combining them with (1) SIT (releases of 1000 males/ha) and (2) BSIT (releases of 1000 males/ha) are represented by pink and blue bars, respectively. The effort devoted to each control action is indicated, either as a rate of breeding sites destroyed for prevention, or as the number of traps/stations per house for ovitraps, BGS-traps and ADT. Three control periods were tested: early in the year (Early) when the mosquito population is low, midway in the year (Mid) when the population is increasing, and later in the year (Late) when the population reaches its maximum. The vector control actions were simulated on a mean weather dynamic and outputs were averaged among the 4 studied parcels (see “Methods”). The red dashed line indicates the number of ovitraps, BGS-traps and ADT stations required to reach the plateau of maximum effect for the action performed alone. The black arrows show the very specific case of the negative reduction rate alone caused by late releases of SIT without any other vector control action.

