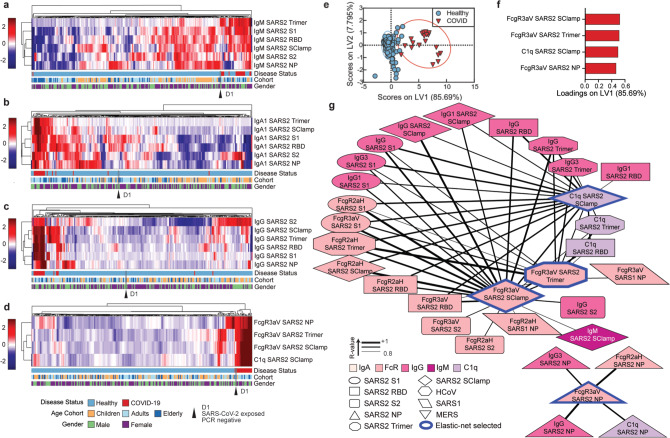
Fig. 4. Healthy versus COVID-19 serological signatures.
Hierarchical clustering of all SARS-CoV-2 antigens for IgM (a), IgA1 (b) and IgG (c). Levels are coloured from low (dark blue) to high (dark red). Hierarchical clustering (d) and PLSDA model scores (e) and loadings (f) were performed using the four-feature Elastic-Net-selected SARS-CoV-2 antigen signature (98.51% calibration accuracy, 98.51% cross-validation accuracy). Variance explained by each LV is in parentheses. g Correlation network analysis for COVID-19 patients was performed to identify features significantly associated with the Elastic-Net-selected features (blue outline). Coded by Ab feature type (colour), antigen (shape) and correlation coefficient (line thickness). Data were z-scored prior to analysis. Multiplex assays were repeated in duplicates.

