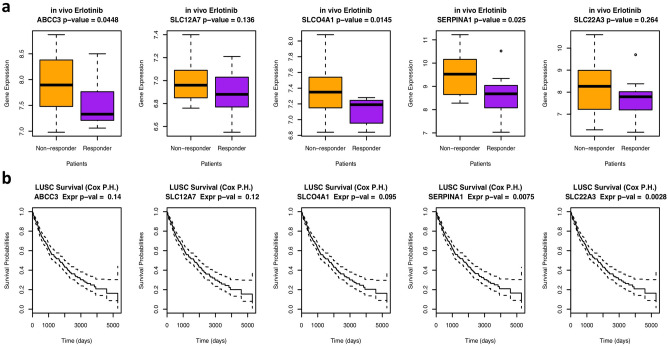
Figure 6.
The expression values of the five potential transporters are different in the responsive vs. resistant patients and can predict patient survival. (a) Boxplot showing the difference in the expression values of the five potential transporters in the responsive vs. resistant patients in an erlotinib clinical trial (GSE33072). The p-value was computed from Student’s t-test by comparing the gene expression in responders versus nonresponders. (b) Cox proportional hazard survival analysis showing how expression values of different genes affect patient survival in the TCGA lung cancer data set, with p-values illustrating the significance of the analysis.

