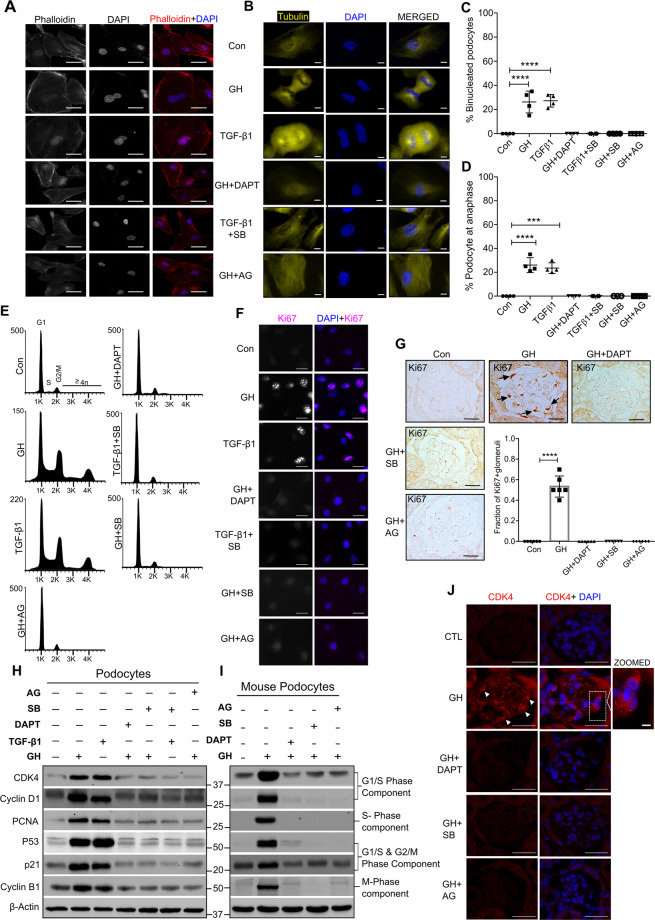
Fig. 3. GH stimulates cell cycle reentry and binucleation in podocytes.
A, B Representative images of F-actin (green color), α-tubulin (yellow color), and counterstained with DAPI (blue color) staining in human podocytes treated with or without treatment for 48 h. Magnification ×630. Scale bar = 20 μm. (n = 3). C The graph represents the % of binucleated podocytes from the above experimental conditions. Mean ± SD. (n = 4). Each data point represents the average value of fifty cells. D The graph represents the % of podocytes accumulated in anaphase from the above experimental conditions. Mean ± SD. (n = 4). C, D ***p < 0.001 and ****p < 0.0001 by one-way ANOVA post hoc Dunnett test. Each data point represents the average value of fifty cells. E Cell cycle phases of podocytes from indicated experimental conditions (n = 4). F Immunofluorescence for the Ki67 (red color) and counterstained with DAPI (blue color). Magnification ×630. Scale bar = 20 μm. (n = 3). G Representative images of immunohistochemistry for anti-Ki67 expression by DAB staining in mice glomerular sections. Quantification of Ki67-postive glomeruli (right panel) where each dot represents the average value of ten glomeruli from each mouse. Black arrow indicates specific expression of Ki67 in podocytes. Magnification ×630. Scale bar = 20 μm. (n = 3). ****p < 0.0001 by one-way ANOVA post hoc Dunnett test. H, I Immunoblotting analysis in human podocytes and mice primary podocytes. (n = 3). J Representative images of immunostaining for CDK4 (red color) and counterstained with DAPI (blue color) in mice glomeruli. Magnification ×630. Scale bar = 20 μm. (n = 3). White arrowhead indicates specific expression of CDK4 in the podocyte.

