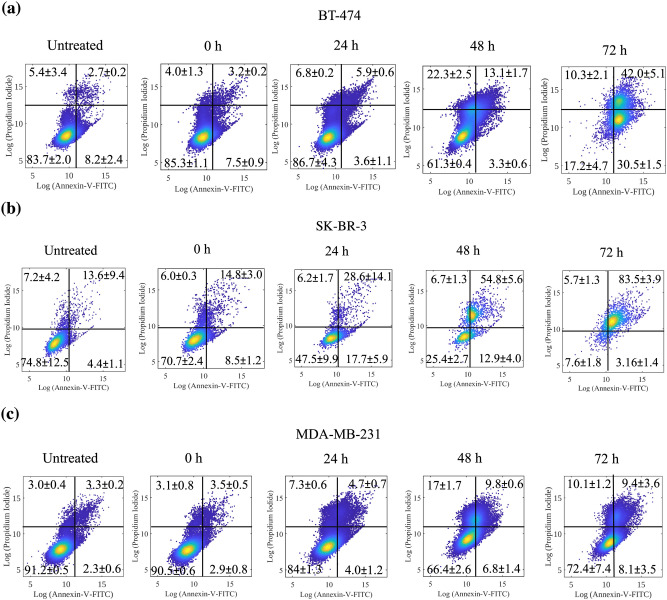
Figure 5.
Evaluation of apoptosis induction. Annexin V-FITC analysis of (a) BT-474, (b) SK-BR-3, and (c) MDA-MB-231 cells untreated and treated with PTXNR-TTZ for 0, 24, 48, and 72 h. Results represent one of three independent experiments. Viable cells are represented in the lower left quadrant. Early apoptosis (Annexin + / PI −) is shown in the lower right quadrant for each panel, while late apoptosis (Annexin + / PI +) is shown in the upper right quadrant. Necrosis (Annexin − / PI +) is shown in the upper left quadrant. Values are presented as means ± SD of triplicate experiments. Detailed statistical analysis (p < 0.05) of the data are shown in SI Table 4.

