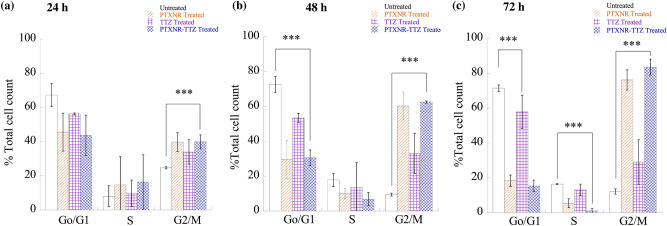
Figure 6.
Cell cycle analysis: BT-474 cells were treated with PTXNR-TTZ, PTXNR alone, and TTZ alone. Cell cycle analysis was performed by flow cytometry after (a) 24 h, (b) 48 h, and (c) 72 h of treatment. Each experiment was replicated at least n = 2 times, and the average cell count data are presented as mean ± standard deviation. Statistically significant differences are shown using *** (p < 0.05; detailed p value calculations are shown in SI Table 5).

