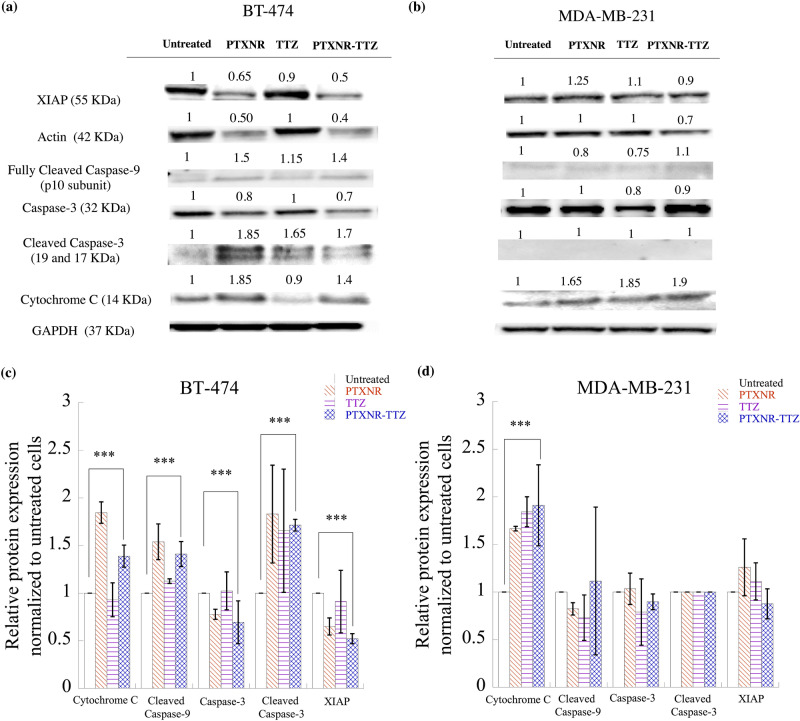
Figure 7.
Western blot analysis: The cell signaling protein expressions of (a) BT-474 and (b) MDA-MB-231 cells using PBS, PTX alone, TTZ alone, and PTXNR-TTX treatments. The relative intensity of XIAP, actin, cleaved caspase-9, caspase 3, cleaved caspase 3, and cytochrome C is analyzed after 48 h of treatment in (c) BT-474 and (d) MDA-MB-231 cells using ImageJ/ Fiji. For each protein expression the experiment was replicated at least n = 2–4 times and the average data is presented as mean ± standard deviation. The relative protein expressions are normalized to the untreated control cells and to the housekeeping GAPDH protein expression (hypothesized expression mean, µ = 1). The p values for overexpression or downregulation of cytochrome-C, cleaved caspase-3, and XIAP in BT-474 are 0.039, 0.003, and 0.000049, respectively. The p value for the overexpression of cytochrome-C in MDA-MB-231 is 0.047. ***Represents p < 0.05 (for detailed p value calculations, please see SI Table 6).

