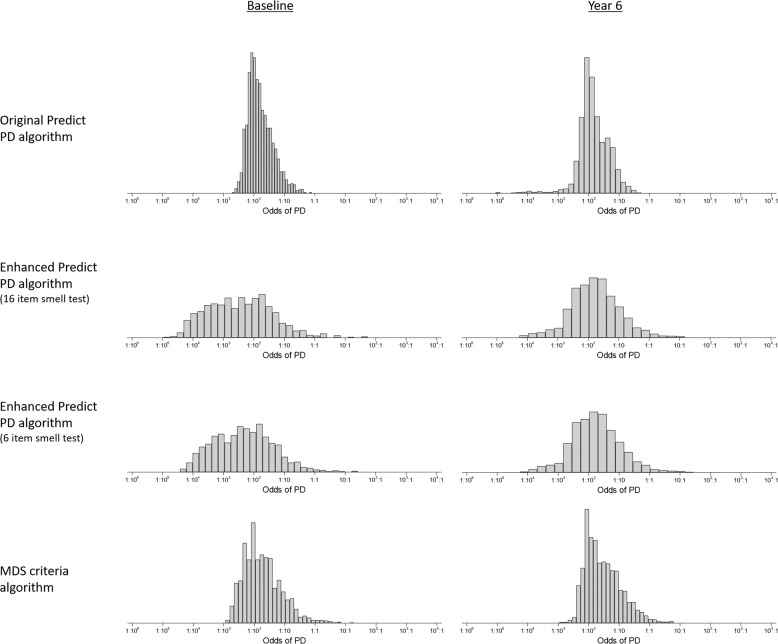
Fig. 1.
Histograms of risk scores for PREDICT-PD participants (presented as odds). Left column shows baseline risks and the right column show risks for the latest survey year. Risks calculated using the basic PREDICT-PD algorithm, the enhanced PREDICT-PD algorithm using a 16 item smell test, the enhanced PREDICT-PD algorithm using a 6-item smell test and the MDS criteria algorithm are shown on the first, second, third and fourth rows respectively.

