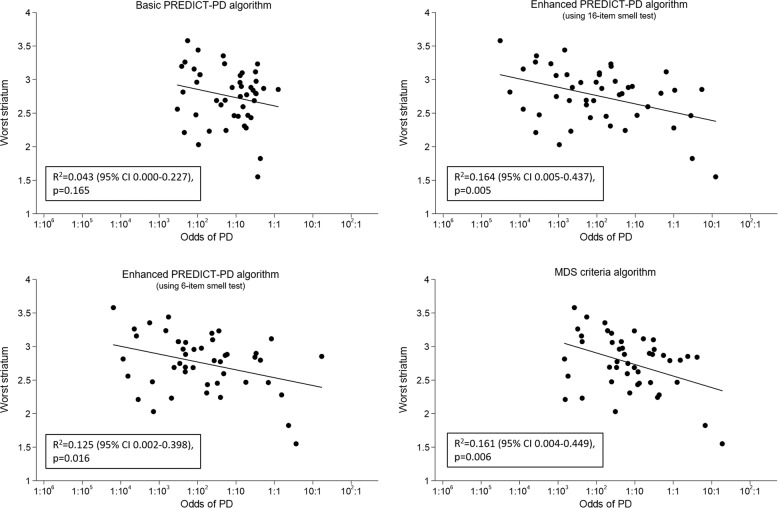
Fig. 2.
Scatterplots and regression lines of risk estimates (presented as odds) against striatal binding ratios on DaT-SPECT imaging. Risks calculated using the basic PREDICT-PD algorithm, the enhanced PREDICT-PD algorithm using a 16 item smell test, the enhanced PREDICT-PD algorithm using a 6-item smell test and the MDS prodromal criteria algorithm are shown in the top left, top right, bottom left and bottom right panels of the figure respectively.

