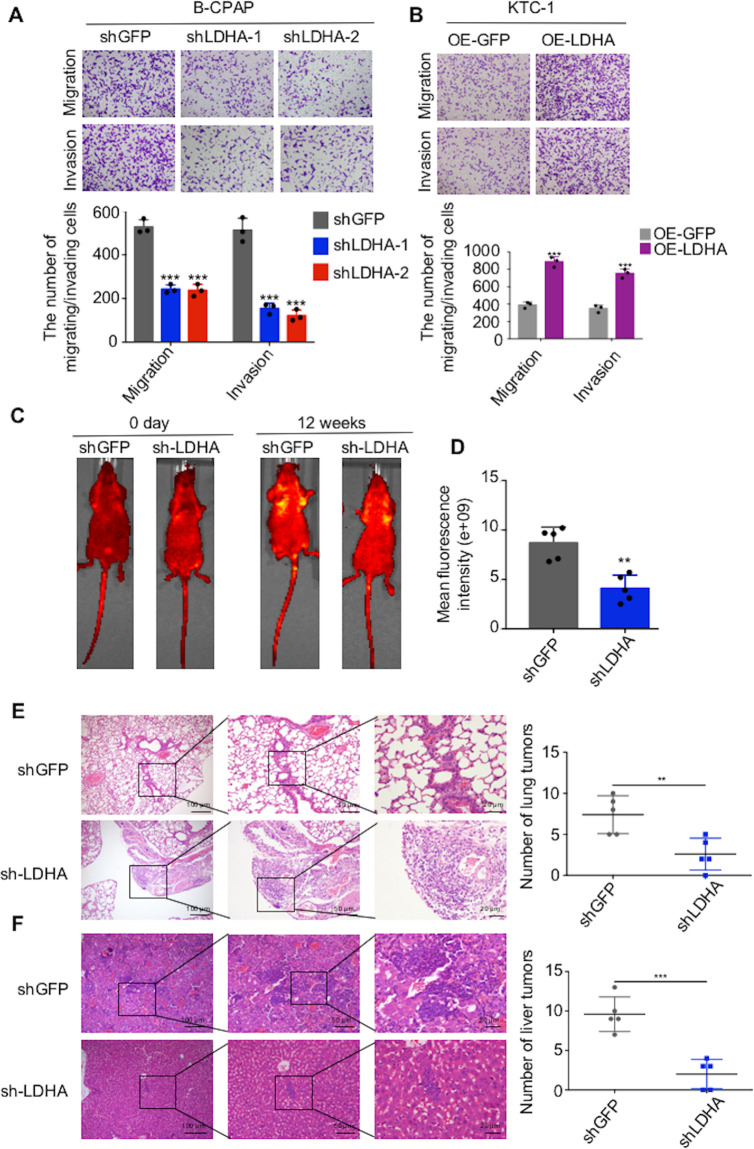
Fig. 3. LDHA promotes the migration and invasion of PTC cells in vitro and in vivo.
A B-CPAP cells were transfected with two different LDHA knockdown plasmids. Representative images of migration/invasion are shown. B Representative images of migrating/invading KTC-1 cells expressing LDHA. C In vivo bioluminescence images of B-CPAP cells transfected with the LDHA knockdown plasmid. D The mean fluorescence intensity of the LDHA knockdown group was significantly lower than that of the control group. E Representative images of lung metastatic foci. The number of lung metastatic foci was significantly lower in LDHA knockdown group than in control group. F Representative images of liver metastatic foci. The number of liver metastatic foci was significantly lower in LDHA knockdown group than in control group. The data are presented as the mean ± SD. All *p < 0.05, **p < 0.01, ***p < 0.001.

