Fig. 1.
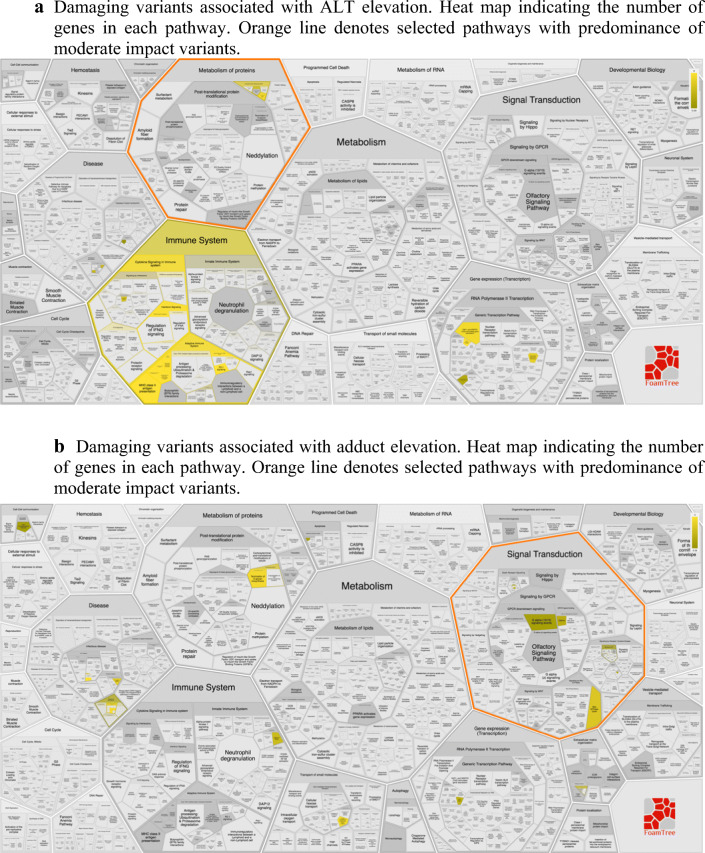
a REACTOME pathway analysis. a Damaging variants associated with ALT elevation. Heat map indicating the number of genes in each pathway. Orange line denotes selected pathways with predominance of moderate impact variants. b Damaging variants associated with adduct elevation. Heat map indicating the number of genes in each pathway. Orange line denotes selected pathways with predominance of moderate impact variants.

