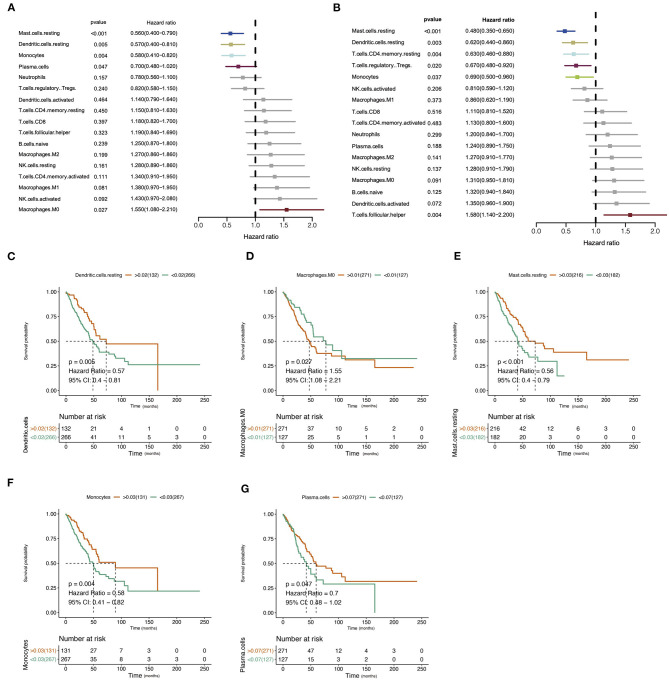
Figure 2.
Correlation of immune infiltration and clinical parameters in lung adenocarcinoma (LUAD). (A) Forest plot showed the correlation of immune infiltration and overall survival (OS). (B) Forest plot showed the correlation of immune infiltration progression-free interval (PFI). (C–G) The Kaplan–Meier diagram showed the correlation of infiltration of immune cells and overall survival (OS).

