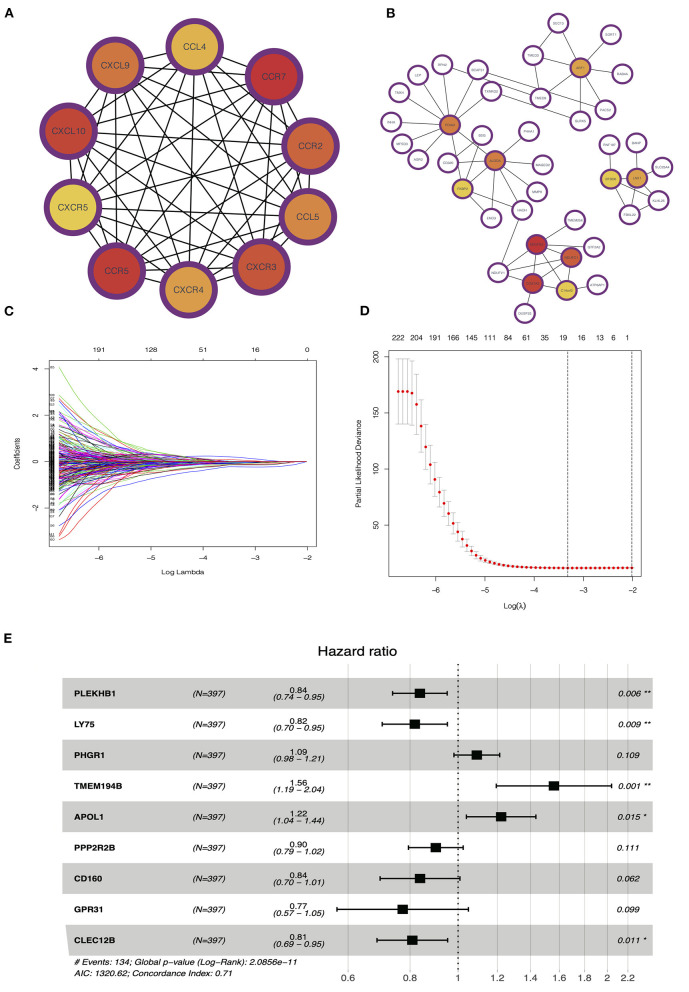
Figure 7.
Identification of hub and prognostic-related genes. (A) Protein–protein interaction (PPI) network of upregulated genes in the hot tumor. (B) PPI network of downregulated genes in the hot tumor. (C,D) Least absolute shrinkage and selection operator (LASSO) and partial likelihood deviance coefficient profiles of the selected genes. (E) Multivariate Cox analysis showed the hazard ratios (HRs) of selected genes with forest plots.

