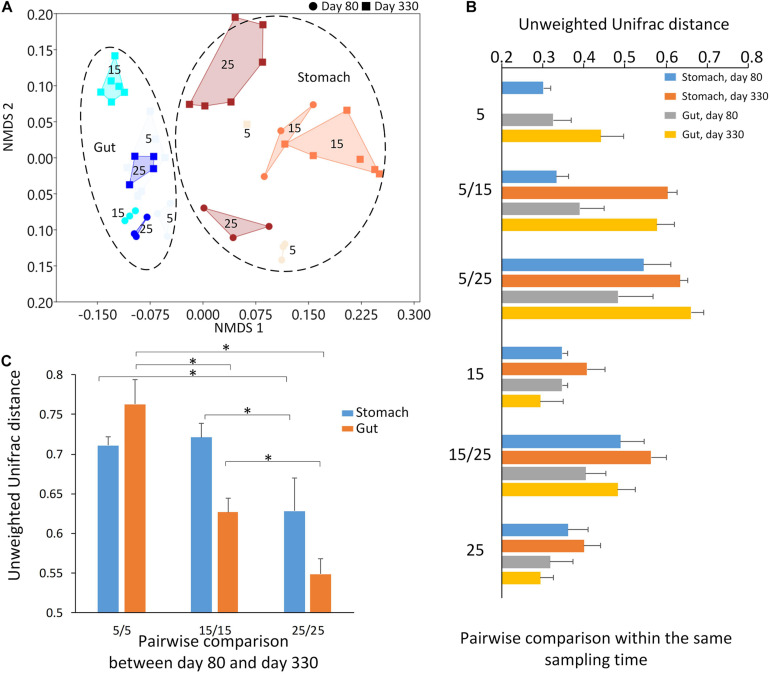
FIGURE 3.
The results of beta diversity among the groups. (A) The NMDS (non-metric multidimensional scaling) cluster analysis using Bray-Curtis distance among all samples (each spot represented one sample). The numbers in the figure represented the degree of the temperature. The closure for each group was generated by Convex Hull (Barber et al., 1996). (B) The pairwise comparisons among the groups in the stomach and gut microbiome under different temperatures within each sampling time. (C) The pairwise comparisons between the first and second sampling time in the stomach and gut microbiome under the same temperature. The one-way ANOVA test was used to test the significant differences in the pairwise comparison distance within the same sample type. If significant, the post hoc test [by Bonferroni correction: significant level at 0.05 (*)] was used to pairwise comparisons.

