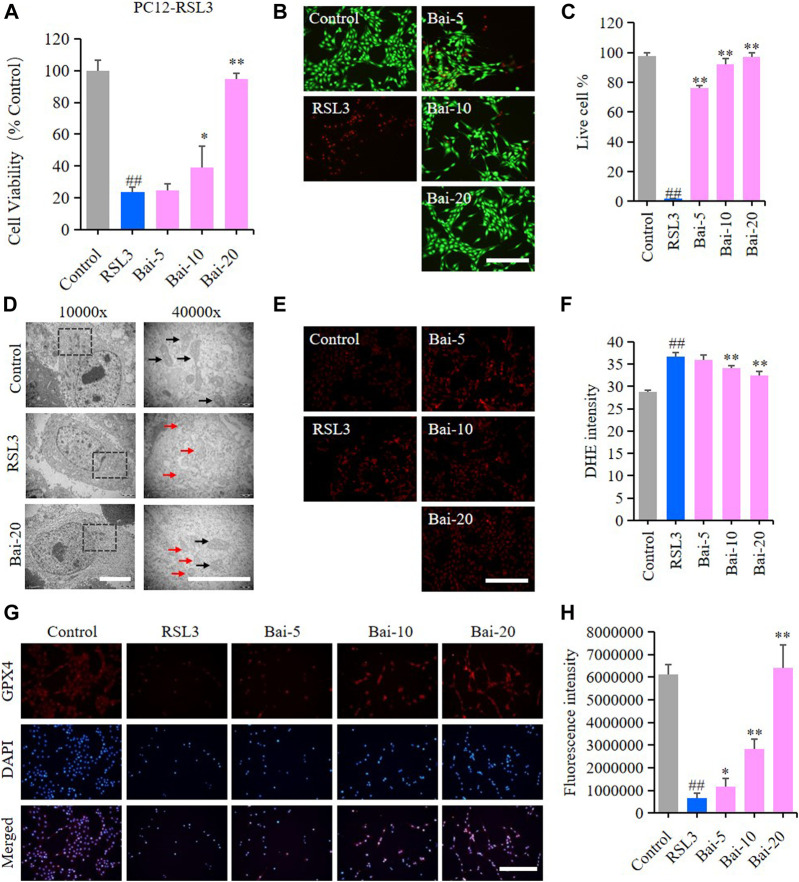
FIGURE 3.
Effect of baicalin on RSL3-induced ferroptosis in PC12 Cells. PC12 cells were cultured in 96-well plates, treated with RSL3 (0.5μM) and corresponding concentrations of baicalin (0, 5, 10 and 20μM) for 24h. Effect of baicalin on the viability of PC12 cells was tested by MTT assay (n = 6) (A) and live/dead cell staining assay. Bar = 200μm (B). (C) The ratio of living cells was counted in different groups (n = 4). (D) TEM images of mitochondrial morphology were obtained and compared between different groups. Black arrows indicate normal mitochondria, and red arrows indicate shrunken mitochondria with cristae broken or disappeared. Bar = 5μm. (E) The fluorescence intensity of DHE represents the ROS concentration in different groups. Bar = 200μm. (F) Relative fluorescence intensity statistics of the ROS concentration in different groups (n = 4). (G) The expression of GPX4 was analyzed using immunofluorescence staining. Bar = 200μm (H) Relative fluorescence intensity statistics of the expression of GPX4 in different groups (n = 4). The experiments were repeated at least three times with three replicates and data were expressed as mean ± SD. ## p < 0.01 compared with the control group and * p < 0.05 and **p < 0.01 compared with the RSL3-treated group.

