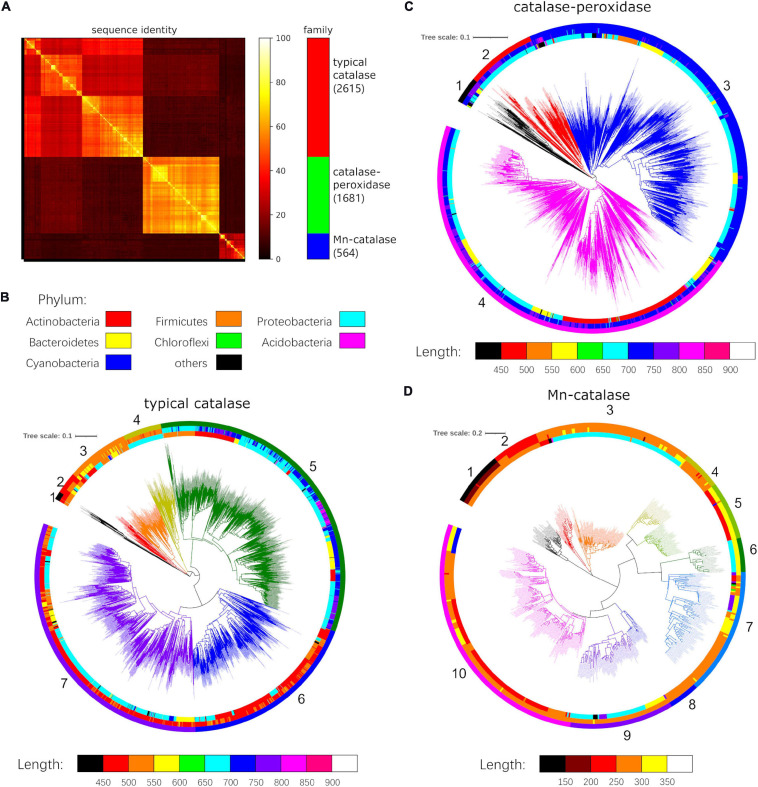
FIGURE 1.
Sequence comparison and phylogenetic analysis of three catalase families. (A) Pairwise sequence identities of all 4,860 catalase homologs. Phylogenetic trees of (B) typical catalases, (C) catalase-peroxidases, and (D) Mn-catalases. The inner strip chart indicates the phylum (red: Actinobacteria, orange: Firmicutes, yellow: Bacteroidetes, cyan: Proteobacteria, green: Chloroflexi, blue: Cyanobacteria, magenta: Acidobacteria, black: others). The middle strip chart denotes the protein length with the corresponding color maps. The outer strip chart indicates the groups of each catalase family.

