
FIGURE 3.
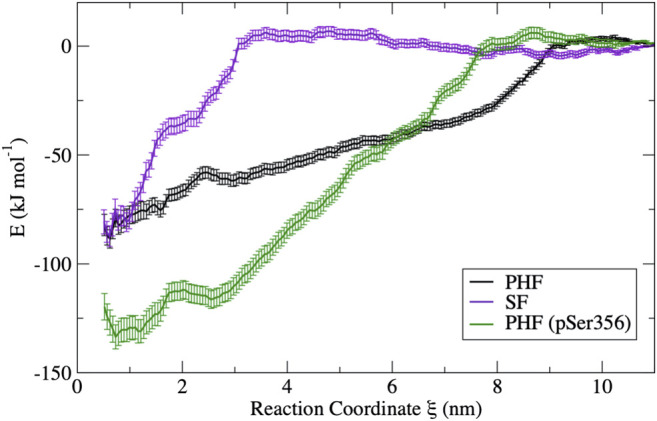
Free energy curves obtained from umbrella sampling simulations for each fibril in this study. The PHF free energy profile (black) and the SF free energy profile (violet) have a similar free energy minimum; however, the different shape reflects a different dissociation mechanism. The PHF fibril is stabilized by phosphorylation at Ser356 (green) despite having a similar mechanism of dissociation. Error bars were determined by bootstrapping.