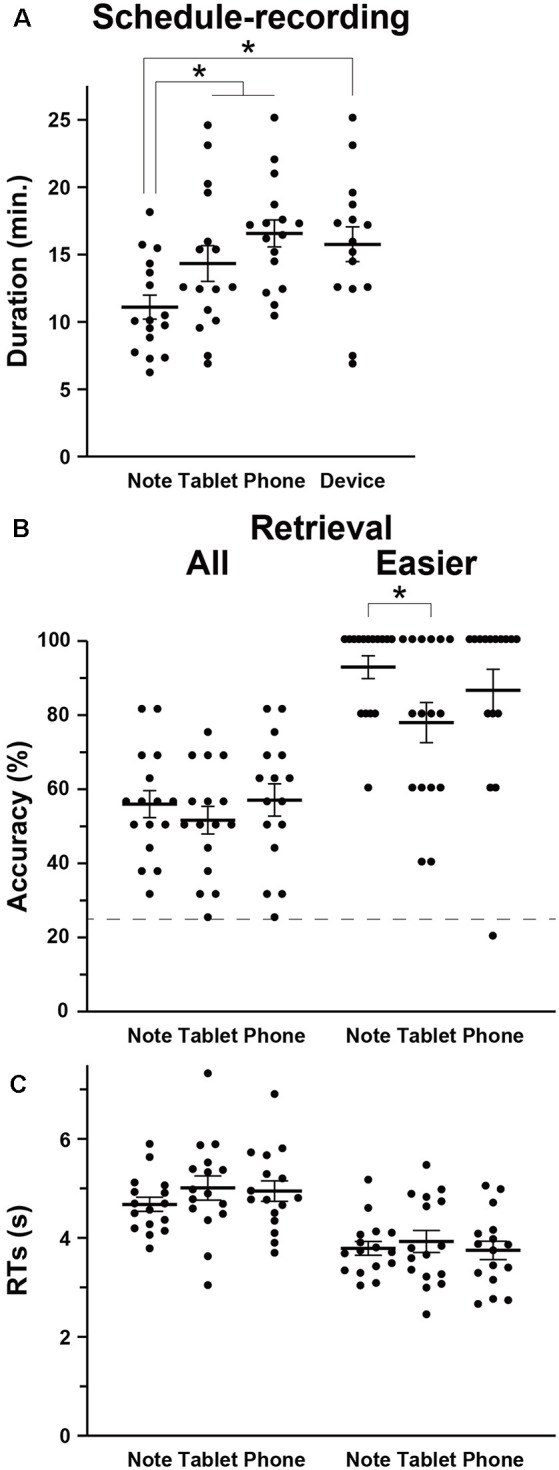
Figure 2.

Behavioral data. (A) The intergroup differences in the mean duration of schedule recording (see Figure 1), together with individual data points overlapped. In addition to the three groups (Note, Tablet, and Phone), we also introduced a Device group, which consisted of participants who used mainly notebooks daily and were assigned to either the Tablet or Phone group. (B) Accuracy in the retrieval task. The broken line denotes the chance level of 25% accuracy. For the easier (i.e., more straightforward) questions, the Note group showed significantly higher accuracy than the Tablet group. (C) Response times (RTs) in the retrieval task. Error bars indicate standard errors of the mean. *p < 0.05.
