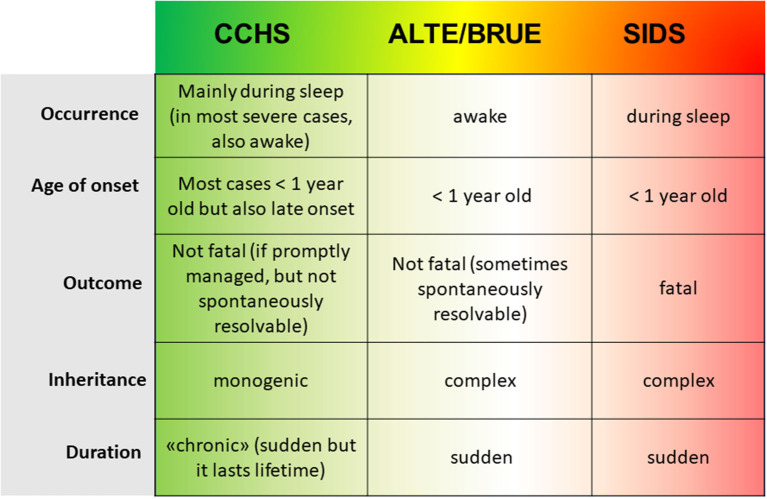
Figure 4.
The scheme represent the clinical and genetic features of the three condition CCHS, ALTE, and SIDS; from left to right, starting from the less severe monogenic CCHS to the fatal complex SIDS, the increase in severity is represented by the color-scale green (CCHS)-yellow (ALTE/BRUE)-red (SIDS).

