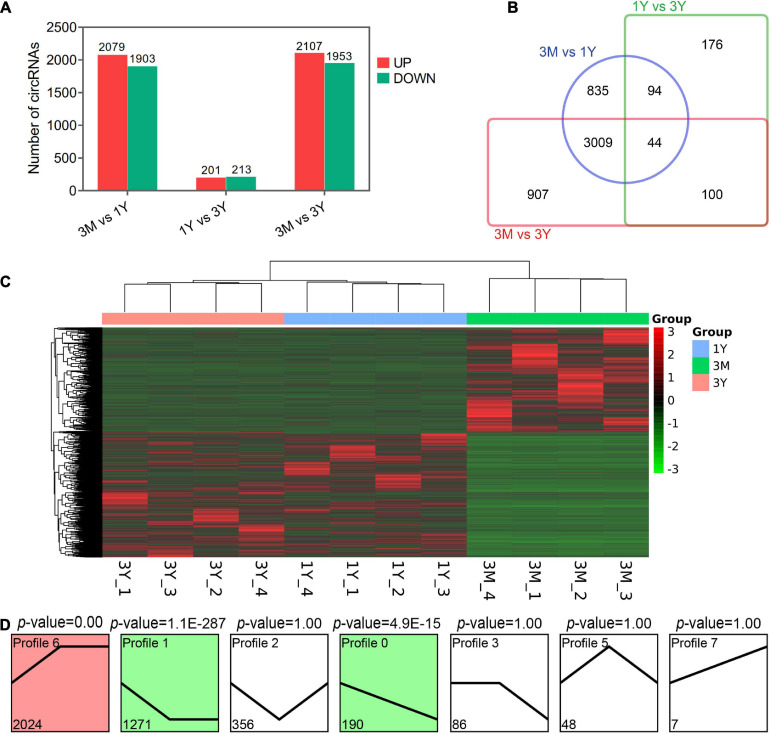
FIGURE 2.
Summary of differential expression analysis of the annotated circRNAs. (A) Statistics of differential circRNAs. (B) A Venn diagram indicating the shared and unique differential circRNAs. (C) Clustering heat map of differential circRNA expression. Red corresponds to upregulation; Green corresponds to downregulation. (D) Trend analysis of differential circRNAs. 3M, 1Y, and 3Y refer respectively to 3-month-old, 1-year-old, and 3-year-old.

