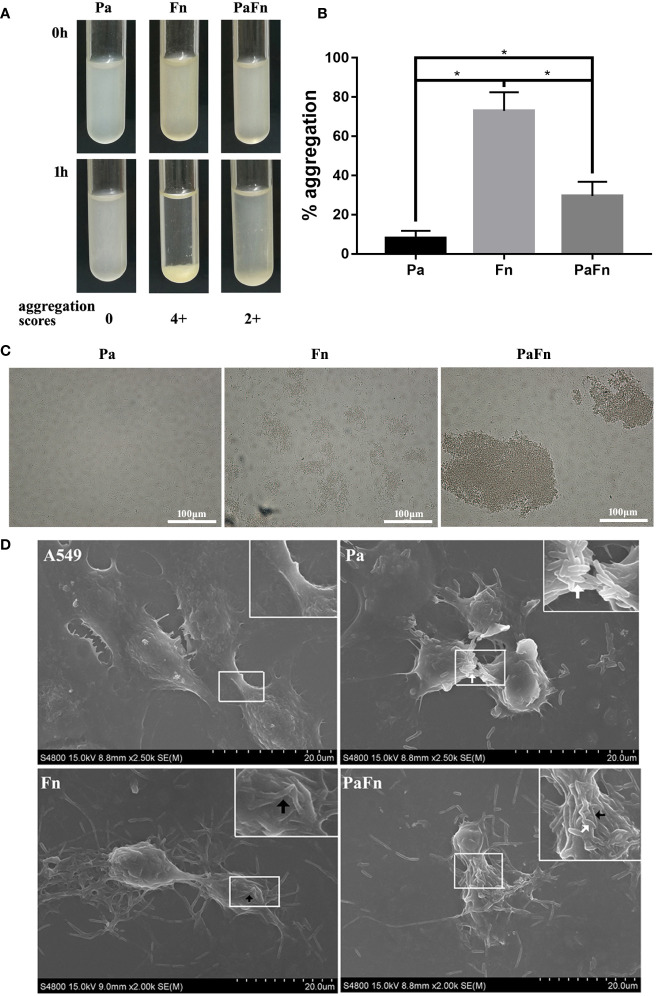
Figure 1.
F. nucleatum coaggregates with P. aeruginosa and adheres to pulmonary epithelial cells. (A) Photographs of autoaggregation and coaggregation of P. aeruginosa and F. nucleatum. The aggregation score of each bacterial group was indicated below the photograph. (B) Percentage aggregation of P. aeruginosa and F. nucleatum. *P < 0.05, statistics were achieved by analysis of variance followed by Tukey’s multiple comparisons test. (C) Representative images of auto- and coaggregation of P. aeruginosa and F. nucleatum observed by phase contrast microscope. (D) Representative SEM images of pulmonary epithelial cells infected with P. aeruginosa and F. nucleatum alone or together. A549 cells were infected with P. aeruginosa (MOI 100) and F. nucleatum (MOI 100) alone or together for 3 h. White arrow indicates P. aeruginosa, and black arrow indicates F. nucleatum. Pa, P. aeruginosa; Fn, F. nucleatum.

