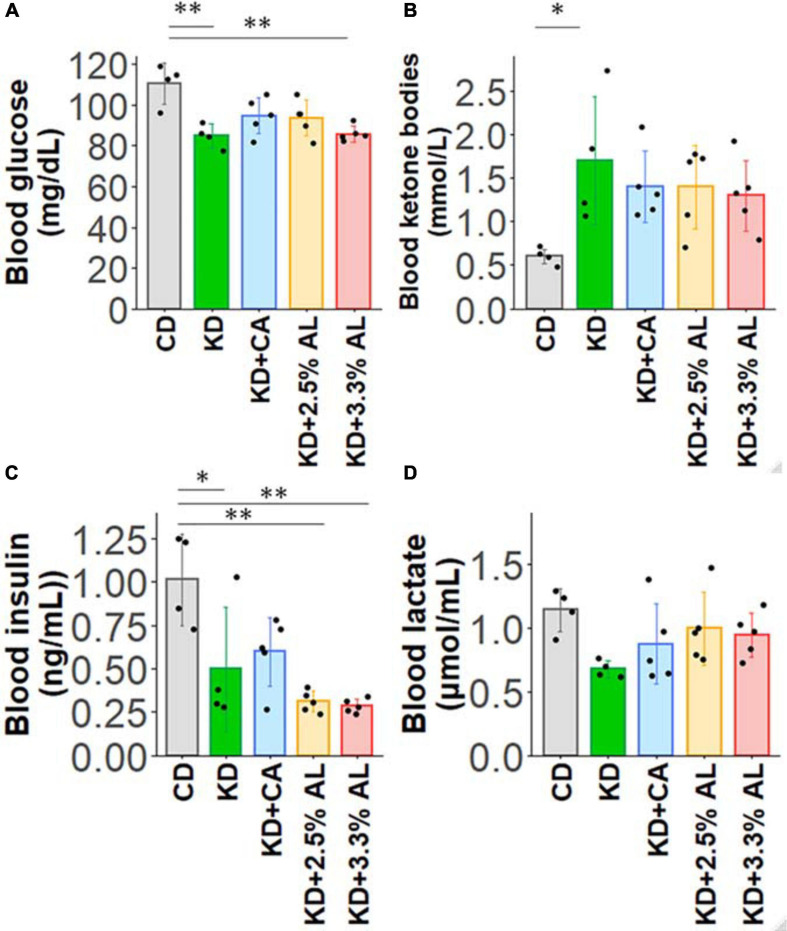
FIGURE 2.
(A) Summary of the average blood glucose concentrations (mg/dl) of CD-fed, normal KD-fed, KD + CA-fed, KD + 2.5% AL-fed, and KD + 3.3% AL-fed rats at 21 days after feeding. F(4, 18) = 7.274, P < 0.01; one-way ANOVA with post hoc test. (B) Summary of average blood ketone body levels (mmol/L) at 21 days after feeding. F(4, 18) = 3.113, P < 0.05; one-way ANOVA with post hoc test. (C) Summary of average blood insulin levels (ng/ml). F(4, 18) = 8.7,08, P < 0.001; one-way ANOVA with post hoc test. (D) Summary of average blood lactate levels (μmol/ml). F(4, 18) = 2.229, P = 0.107; one-way ANOVA with post hoc test. CD, n = 4; normal KD, n = 4; KD + CA, n = 5; KD + 2.5% AL, n = 5; KD + 3.3% AL, n = 5; ∗P < 0.05; ∗∗P < 0.01.

