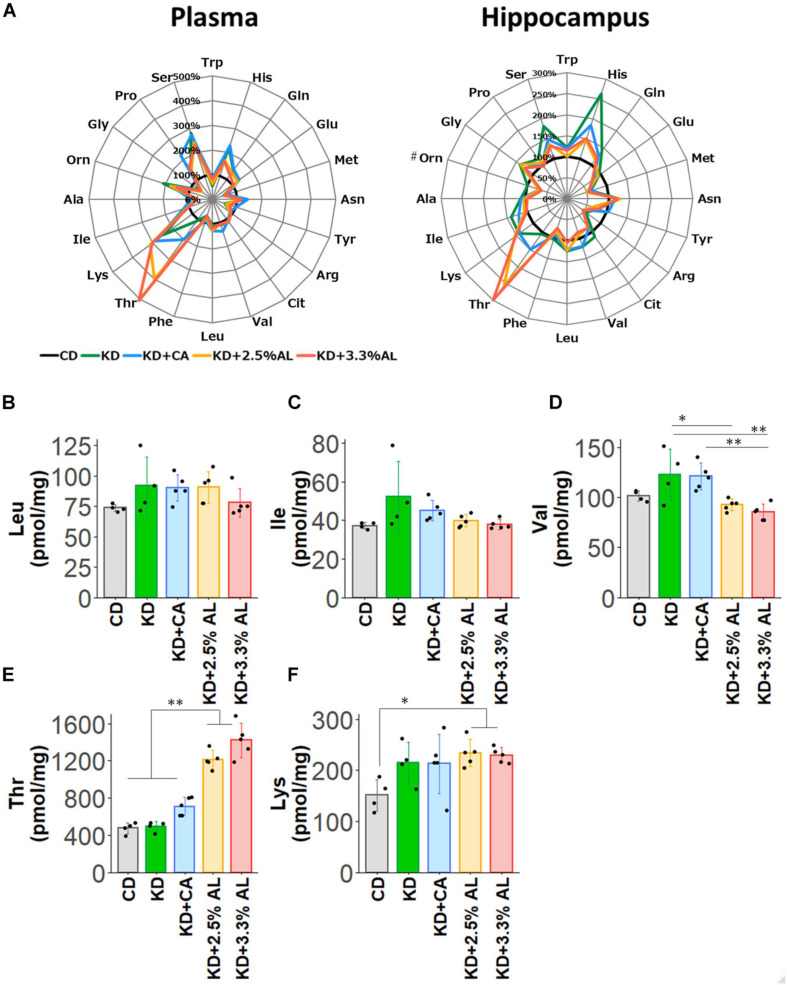
FIGURE 5.
(A) Radar charts of amino acid profiles of CD-fed, normal KD-fed, KD + CA-fed, KD + 2.5% AL-fed and KD + 3.3% AL-fed rats at 21 days after feeding. Results are shown for plasma (left) and hippocampus (right). The average levels of amino acids in each diet are compared with the levels in CD-fed and expressed in percentage when CD-fed rats (black) is 100%. #, removing outliers; Trp, tryptophan; His, histidine; Gln, glutamine; Glu, glutamic acid; Met, methionine; Asn, asparagine; Tyr, tyrosine; Arg, arginine; Cit, citrulline; Val, valine; Leu, leucine; BCAAs, branched-chain amino acids; Phe, phenylalanine; Thr, threonine; Lys, lysine; Ile, isoleucine; Ala, alanine; Orn, ornithine; Gly, glycine; Pro, proline; Ser, serine. (B) Summary of the average concentration of Leu in the hippocampus (pmol/mg). F(4, 18) = 1.614, P = 0.214; one-way ANOVA with post hoc test. (C) Summary of the average concentration of Ile in the hippocampus (pmol/mg). F(4, 18) = 2.456, P = 0.0829; one-way ANOVA with post hoc test. (D) Summary of the average concentration of Val in the hippocampus (pmol/mg). F(4, 18) = 7.494, P < 0.001; one-way ANOVA with post hoc test. (E) Summary of the average concentration of Thr in the hippocampus (pmol/mg). F(4, 18) = 66.991, P < 0.0001; one-way ANOVA with post hoc test. (F) Summary of the average concentration of Lys in the hippocampus (pmol/mg). F(4, 18) = 3.362, P < 0.05; one-way ANOVA with post hoc test. CD, n = 4; normal KD, n = 4; KD + CA, n = 5; KD + 2.5% AL, n = 5; KD + 3.3% AL, n = 5; ∗P < 0.05; ∗∗P < 0.01.

