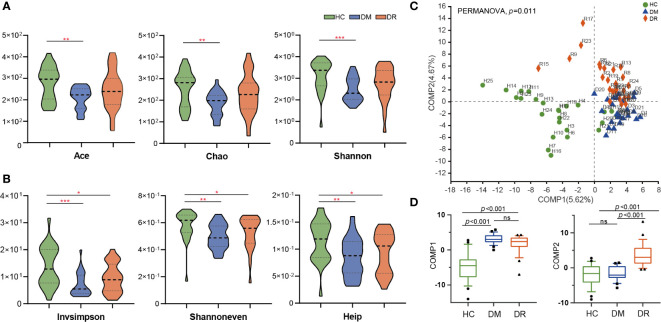
Figure 2.
Comparison of α-diversity and β-diversity in diabetic patients without retinopathy (DM), diabetic patients with retinopathy (DR), and healthy controls (HC). (A) Ace, Chao, and Shannon α-diversity indices were significantly decreased in DM compared with HC (p = 0.0026, p = 0.0030 and p = 0.0005, respectively, Wilcoxon rank-sum test). However, these three indices were not statistically different between the DM and DR groups, or the DR and HC groups. (B) Invsimpson, Shannoneven, and Heip α-diversity indices were significantly decreased in the DM and DR groups relative to the HC group (p < 0.05). However, these indices did not reach statistical significance between the DM and DR groups. (C) PLS-DA analysis showed a distinct separation in the three groups at the OTU level (PERMANOVA, p = 0.011). (D) At the component 1 (COMP1) PLS-DA analysis, both DM and DR were significantly different from HC. At the COMP2 PLS-DA analysis, both HC and DM were significantly different from DR (all p < 0.001; Kruskal–Wallis test). PLS-DA, Partial Least Squares Discriminant Analysis. OUT, operational taxonomic units. *p < 0.05, **p < 0.01,***p < 0.001; ns, no significance.

