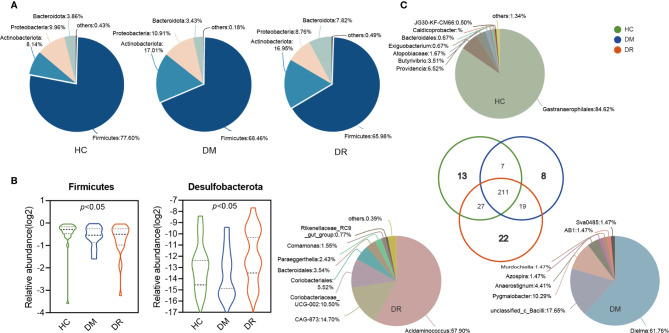
Figure 3.
Variations in fecal microbiota composition at the genus level in diabetic patients without retinopathy (DM), diabetic patients with retinopathy (DR), and healthy controls. (A) The pie shows the relative proportions of bacterial phyla in the DM, DR, and controls, respectively. The Firmicutes, Actinobacteria, Proteobacteria, and Bacteroidota were the most dominant phyla in each group. Firmicutes levels were lower in the DR group compared with the DM and HC groups. There were no statistical differences in Actinobacteriota, Proteobacteria, and Bacteroidota in the three groups. (B) The relative abundance of Firmicutes and Desulfobacterota showed significant differences in the three groups (both p < 0.05; Kruskal–Wallis test). (C) The pie shows the overlapped and unique genera in the three groups. Most of the genera (211) overlapped and were observed in all groups. In total, 13, 8, and 22 genera were detected only in HC, DM, and DR groups, respectively.

