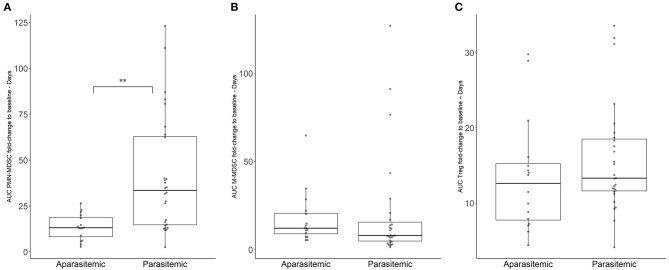
Figure 2.
Variation of immunosuppressive cell populations in blood during CHMI. Immunosuppressive cell populations were estimated by flow cytometry. Area under the cell FC to baseline-days curve (AUC) was estimated for (A) PMN-MDSC, (B) M-MDSC, (C) Treg. Boxplots reflect median, interquartile range as well as the min/max range. The significant difference between AUC in parasitemic and aparasitemic was specifically labeled (**p < 0.001).

