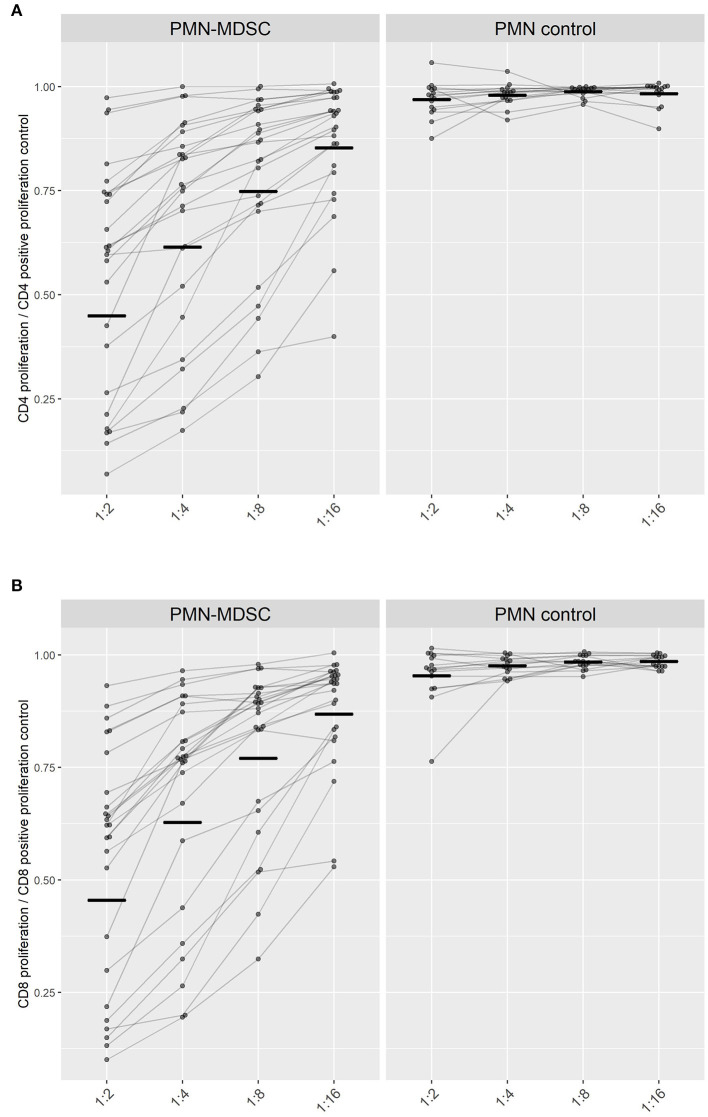
Figure 4.
Suppression of T cell proliferation by PMN-MDSC isolated on day C Malaria. The proliferation capacity of (A) CD4+ T cells and (B) CD8+ T cells is represented in relation to the maximum proliferation capacity of T cells when incubated alone (set to 1). Ratio of PMN or PMN-MDSC to PBMC were adjusted to 1:2, 1:4, 1:8, 1:16 cells. Paired measurements of the inhibitory capacities of PMN-MDSC (left) or PMN (right) within the same volunteer at different cellular ratios are connected by lines. Black short lines represent the geometric mean for every group.

