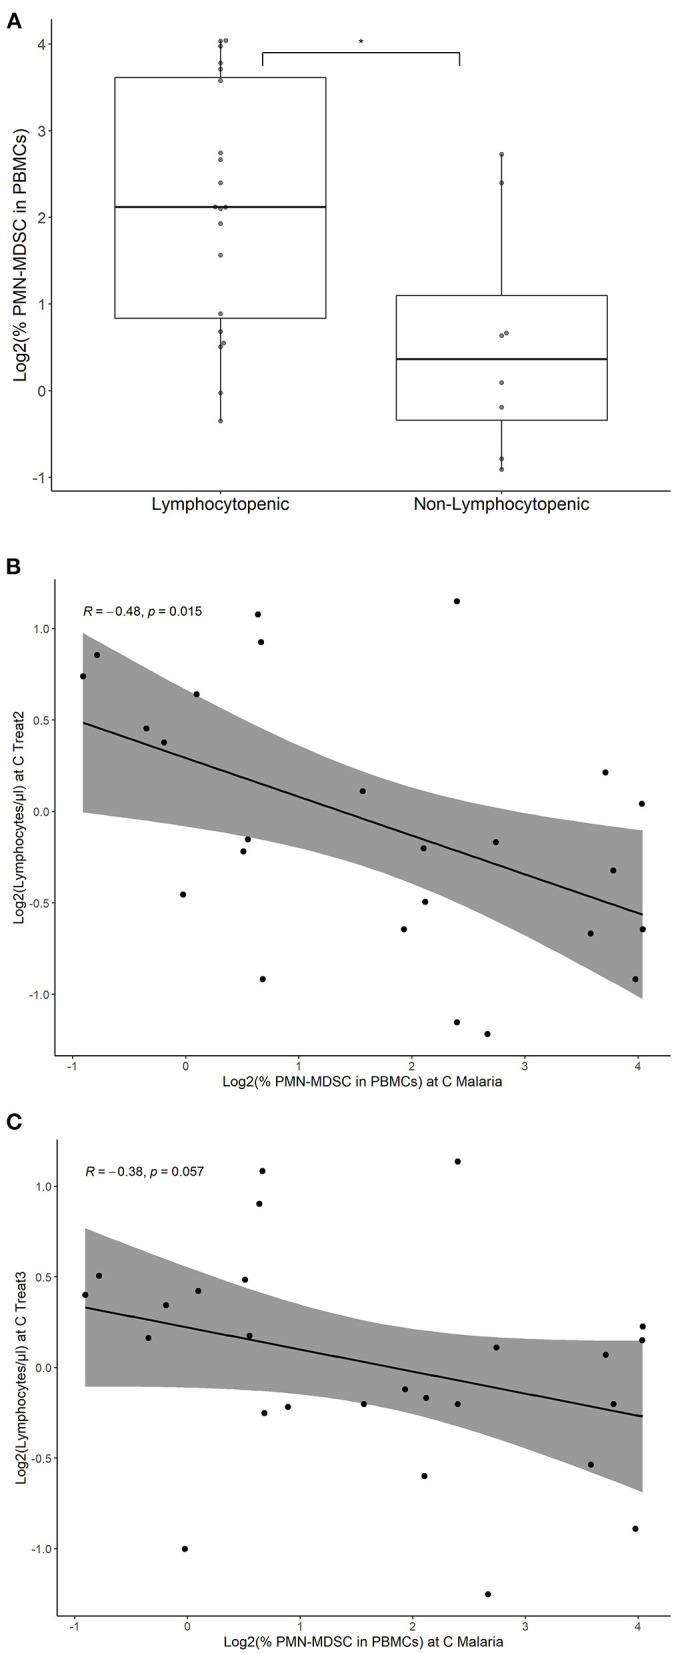
Figure 5.

PMN-MDSC at C Malaria in subsequent lymphocytopenia in volunteers with parasitemia. Percentage of PMN-MDSC at C Malaria were estimated by flow cytometry, both in participants developing lymphocytopenia and volunteers not developing lymphocytopenia. Only individuals developing parasitemia during CHMI are shown. (A) The individual points represent the fraction of PMN-MDSC in the PBMC for each individual. Boxplots represent the median % PMN-MDSC, the IQR and the lines show the range (min/max) for the two groups. Lymphocytopenia was defined as ≤ 1.2 × 10³ lymphocytes per μl. *p < 0.05. Correlation of PMN-MDSC levels at C Malaria and lymphocyte levels at C Treat2 (B) and C Treat3 (C) are shown. The line represents the linear regression and the gray area represents the 95% confidence interval. Spearman's rank correlation test was performed and the respective correlation coefficients (R) and p-values were given.
