FIGURE 2.
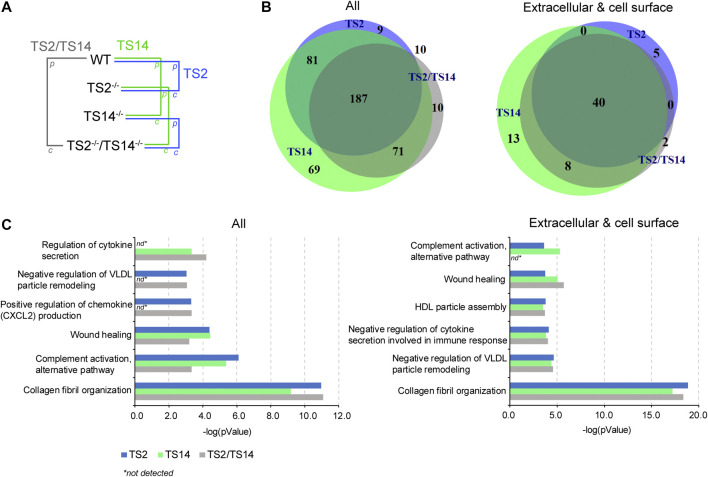
ADAMTS2 and 14 degradomes in mouse skin and their biological processes. (A) Schematic view of the multiple comparisons of the P/C ratios analyzed for each iTRAQ-TAILS experiment (n = 3). The function of the ADAMTS2 (in blue) is investigated by the comparison of wild type (Wt) mice with those deficient for ADAMTS2 (TS2−/−) and from the comparison of the mice deficient for ADAMTS14 (TS14−/−) with those deficient for ADAMTS2 and ADAMTS14 (TS2−/−TS14−/−). The potential substrates of ADAMTS14 (in green) were identified from the comparison of Wt mice with the mice deficient for ADAMTS14 (TS14−/−) and from the comparison of the mice deficient for ADAMTS2 (TS2−/−) with those deficient for ADAMTS2 and ADAMTS14 (TS2−/−TS14−/−). The common substrates of ADAMTS2 and 14 (red) were obtained from the comparison between Wt mice and TS2−/−TS14−/− mice, and by combining data obtained specifically for Adamts2 and for Adamts14. (B) Venn diagram showing the common and specific N-terminally labeled proteins related to ADAMTS2 (blue), ADAMTS14 (green) or ADAMTS2 and ADAMTS14 (green). All the 437 unique proteins (287 identified by comparing Wt to TS2−/−, 408 by comparing Wt to TS14−/− and 278 by comparing Wt to TS2−/−TS14−/−) showing a P/C ratio above or below three sigma cutoff from the normal distribution of natural N-termini are reported on the left. The 68 extracellular and cell surface proteins related to ADAMTS2 or ADAMTS14 activities (45 by comparing Wt to TS2−/−, 61 by comparing Wt to TS14−/− and 50 by comparing Wt to TS2−/−TS14−/−) are reported on the right. (C) Biological processes related to all the proteins affected by ADAMTS2 and ADAMTS14 in mouse skin (left panel) or related to the extracellular and cell surface substrates (right panel). The biological processes have been identified using the Panther database (Mi et al., 2019). Statistical Overrepresentation test was performed using the whole Mus musculus as reference dataset, the pValue is determined using the Fisher’s Exact test and corrected by the determination of the false discovery rate (fdr). The fdr is below 0.05 for all the biological processes reported. nd: not detected.

