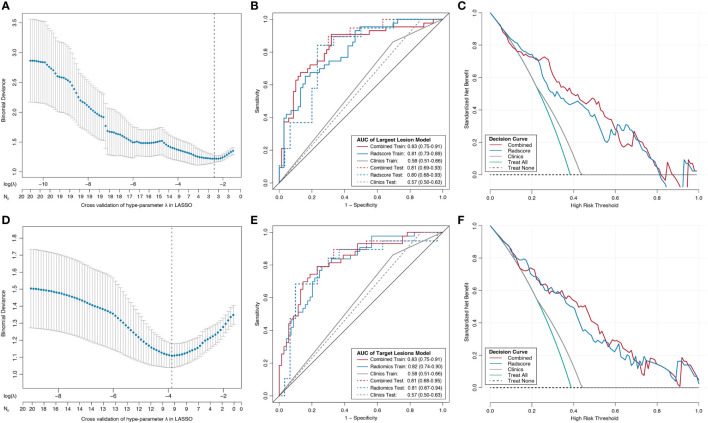
Figure 3.
Radiomics feature selection using the least absolute shrinkage and selection operator (LASSO) binary logistic regression model, the developed nomograms with corresponding decision curves. (A, D) Tuning penalty factor (λ) in the LASSO model used 10-fold cross-validation via minimum criteria. The binomial deviance metrics (the y-axis) were plotted against log (λ) (the upper x-axis) and the number of selected features (the bottom x-axis). Blue dots indicate the average AUC for each model at the given λ, and vertical bars through the red dots show the upper and lower values of the binomial deviance in the cross-validation process. Dotted vertical black lines define the optimal λ, where the model provides its best fit to the data with optimal subset of variables. Receiver operating characteristic (ROC) curves comparison among combined radiomics model (red), radiomics model (blue), and clinical model (gray) for training set (solid line) and test set (dashed line) from the LL approach (B) and TL approach (E). The combined radiomics model incorporating radiomics signature and clinical factor of distant metastasis showed the highest AUC. Decision curve analysis for the combined radiomics nomogram (red), radiomics signature (blue), and clinical model (gray) from the LL (C) approach and TL approach (F). The y-axis indicates the net benefit; x-axis indicates threshold probability. The green line represents the assumption that all patients were responders. The black dotted line represents the hypothesis that no patients were responders.

